Dashboard Cards
Cards are the building blocks of your dashboards. Each card shows specific information that you can resize, move, and configure.
Card Features
Every card has:
Drag handle - Move it aroundMenu button - Configure, replace, or removeAI button - Ask AI about this cardExpand button - Make it full screenRefresh indicator - See when data was last updated
All 110+ Card Types
The console ships with 115+ built-in cards, and you can create more using the Card Factory. Below are the main categories.
Cluster Health Cards (7)
# Card What it shows 1 Cluster Health Health status of all clusters with green/red/gray indicators 2 Cluster Metrics Time-series graphs of CPU, memory, pods, nodes 3 Cluster Focus Detailed view of specific cluster 4 Cluster Comparison Side-by-side comparison of multiple clusters 5 Cluster Costs Cost breakdown per cluster 6 Upgrade Status Version info and available upgrades 7 Cluster Resource Tree Hierarchical view of cluster resources
Workload Cards (6)
# Card What it shows 8 Deployment Status Donut chart of deployment health 9 Deployment Issues Table of deployments with problems 10 Deployment Progress Rollout progress gauge 11 Pod Issues Table of pods with problems (crashes, OOM, etc.) 12 Top Pods Bar chart of top resource-consuming pods 13 App Status Overall application health status
Compute Cards (8)
# Card What it shows 14 Compute Overview Summary of CPU, memory, nodes, pods, GPUs 15 Resource Usage Gauge showing CPU/memory/GPU utilization 16 Resource Capacity Bar chart of used vs available resources 17 GPU Overview Summary of GPU resources and utilization 18 GPU Status Donut chart of GPU allocation 19 GPU Inventory Table of GPU nodes with types and counts 20 GPU Workloads Table of workloads using GPUs 21 GPU Usage Trend Time-series graph of GPU utilization
Storage Cards (2)
# Card What it shows 22 Storage Overview Summary of storage resources 23 PVC Status Table of Persistent Volume Claims
Network Cards (3)
# Card What it shows 24 Network Overview Summary of network resources 25 Service Status Table of services 26 Cluster Network Network status per cluster
GitOps Cards (7)
# Card What it shows 27 Helm Release Status Status of Helm releases 28 Helm History Event timeline of Helm deployments 29 Helm Values Diff Compare Helm values between releases 30 Chart Versions Available chart version updates 31 Kustomization Status Status of Kustomize overlays 32 Overlay Comparison Compare Kustomize overlays 33 GitOps Drift Detect when clusters don’t match git
ArgoCD Cards (3)
# Card What it shows 34 ArgoCD Applications Status of ArgoCD apps 35 ArgoCD Sync Status Donut chart of sync status 36 ArgoCD Health Health status of ArgoCD
Operator Cards (3)
# Card What it shows 37 Operator Status Status of OLM operators 38 Operator Subscriptions Table of operator subscriptions 39 CRD Health Health of Custom Resource Definitions
Namespace Cards (4)
# Card What it shows 40 Namespace Overview Summary of namespace resources 41 Namespace Quotas Gauge of quota usage 42 Namespace RBAC Table of RBAC rules 43 Namespace Events Event stream for namespace
Security & Events Cards (3)
# Card What it shows 44 Security Issues Table of security problems 45 Event Stream Live event feed 46 User Management Table of console users
Live Trend Cards (4)
# Card What it shows 47 Events Timeline Time-series of events 48 Pod Health Trend Time-series of pod health 49 Resource Trend Time-series of resource usage 50 GPU Utilization Time-series of GPU usage
AI Cards (3)
# Card What it shows 51 AI Issues Issues detected by AI 52 Kubeconfig Audit Audit of your kubeconfig 53 AI Health Check AI health check gauge
Alerting Cards (2)
# Card What it shows 54 Active Alerts Currently firing alerts 55 Alert Rules Table of alert rules
Cost Cards (3)
# Card What it shows 56 Cluster Costs Cost per cluster 57 OpenCost Overview OpenCost integration data 58 Kubecost Overview Kubecost integration data
Policy Cards (2)
# Card What it shows 59 OPA Policies OPA Gatekeeper policies 60 Kyverno Policies Kyverno policy status
Compliance Cards (3)
# Card What it shows 61 Compliance Score Overall compliance percentage (CIS, NSA, PCI) 62 Compliance Findings Table of compliance findings by severity 63 Security Posture Combined security posture overview
Provider Health Cards (1)
# Card What it shows 64 Provider Health Status of AI providers (Claude, OpenAI, Gemini) and cloud providers
Workload Monitor Cards (2)
# Card What it shows 65 Workload Status Cascading cluster/namespace/workload selector with resource details 66 Resource Allocation Resource allocation across clusters
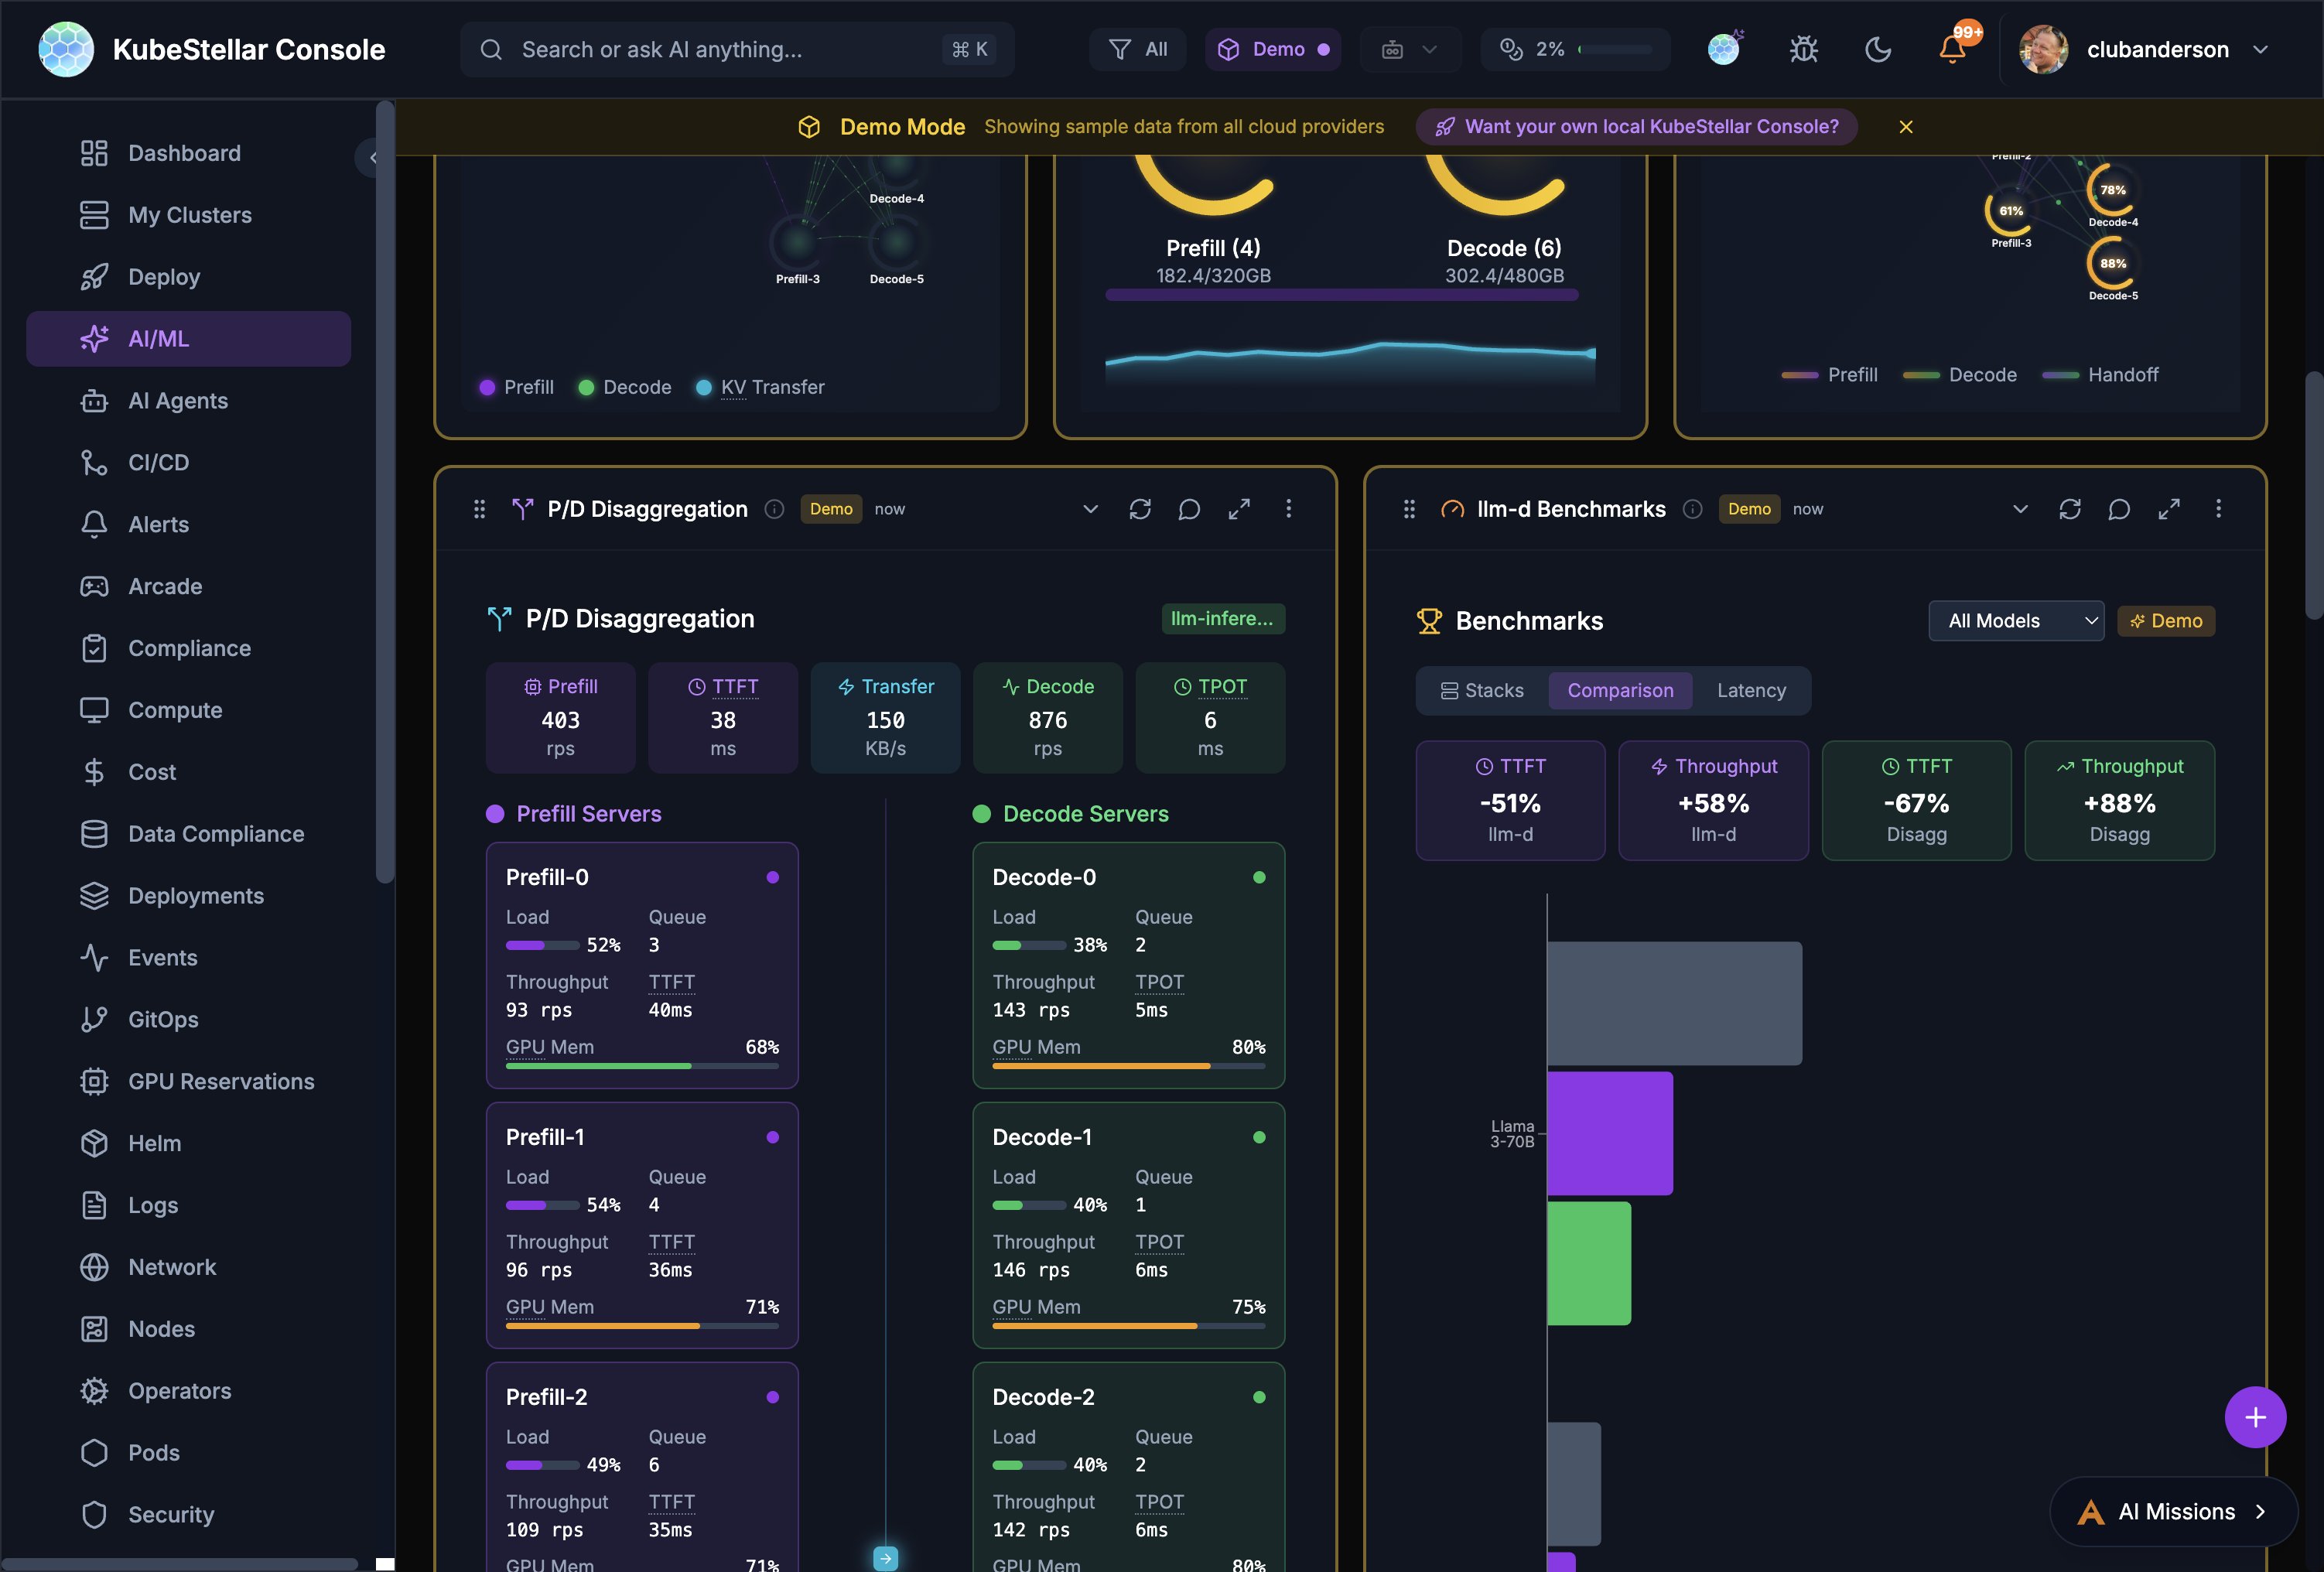
llm-d Inference Cards (10)
llm-d Cards # Card What it shows 67 llm-d Request Flow Animated request flow through the inference stack with throughput/latency metrics 68 KV Cache Monitor KV cache utilization, per-pod cache stats, aggregated/per-pod toggle 69 EPP Routing Endpoint Picker routing decisions with RPS and routing distribution 70 P/D Disaggregation Prefill and Decode server load, queue depth, throughput, TPOT, GPU memory 71 llm-d Benchmarks Stacks vs Comparison vs Latency views with TTFT, throughput, bar charts 72 llm-d AI Insights AI-generated insights about balanced P/D configuration and optimization 73 llm-d Configurator Configure inference strategies: Intelligent Scheduling, P/D Disaggregation, Wide Expert Parallelism, Variant Autoscaling
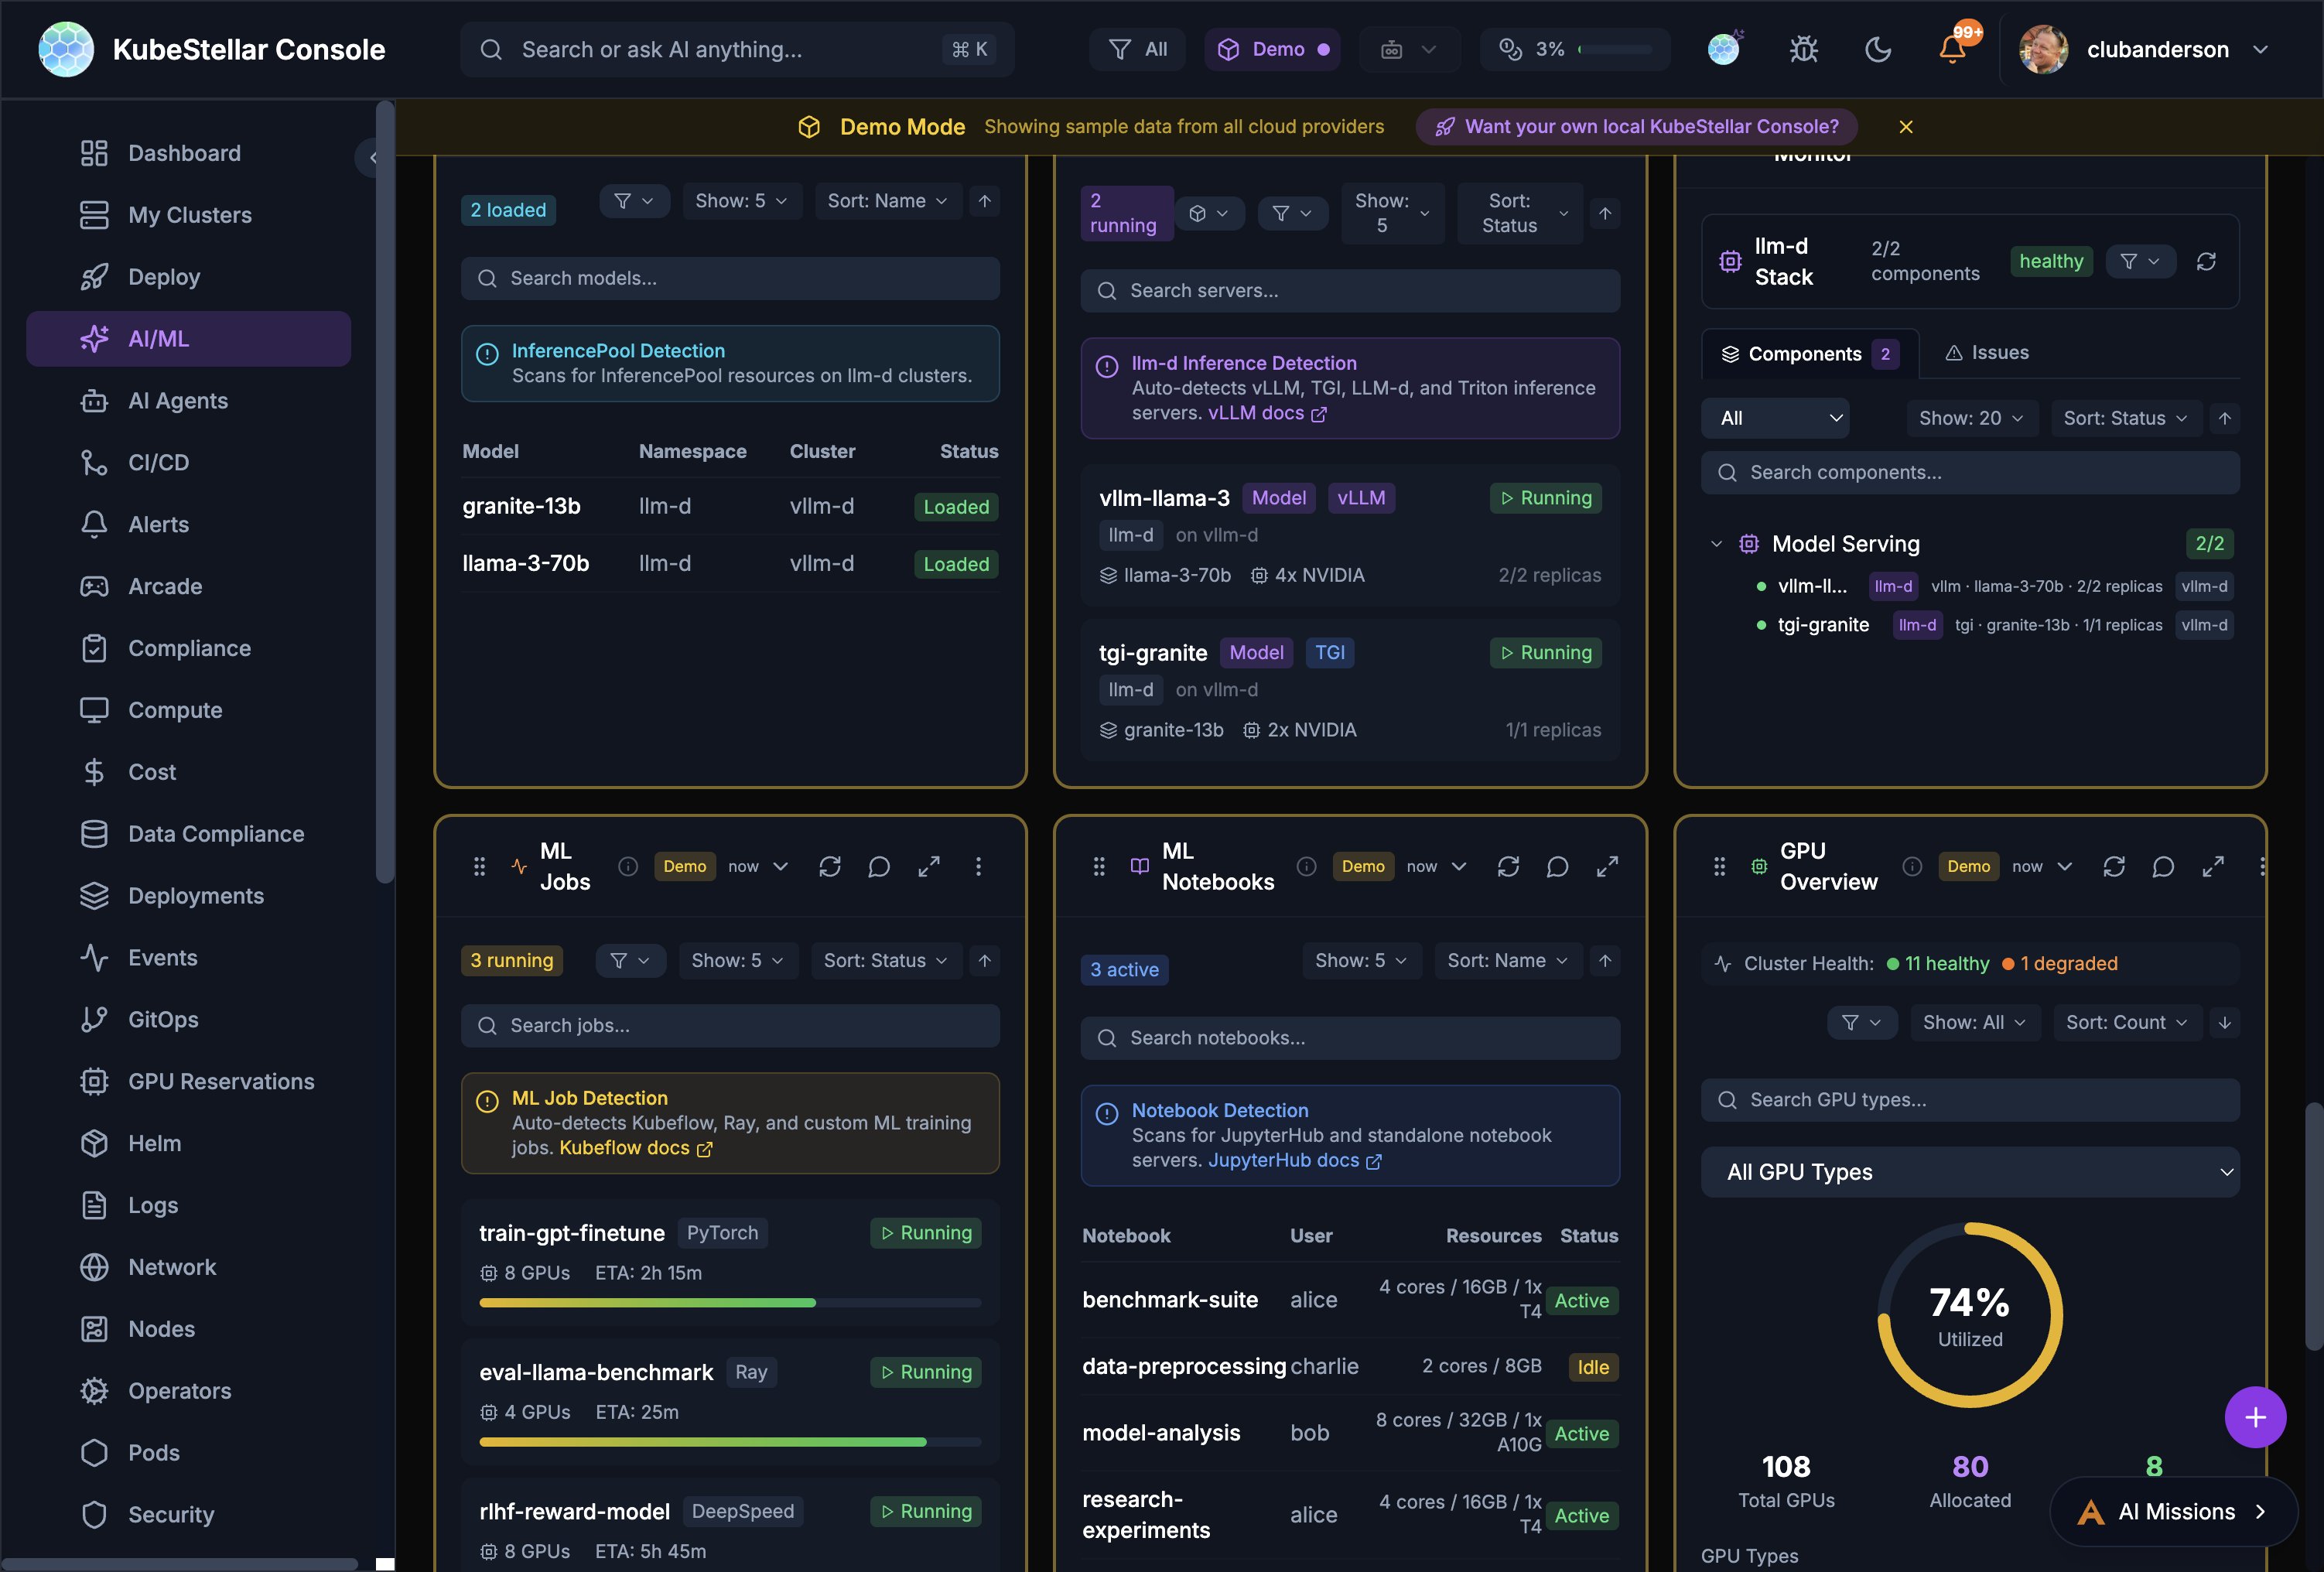
llm-d Stack # Card What it shows 74 llm-d Stack Stack health, component status, model serving details with cluster discovery 75 llm-d Models Loaded models with namespace, cluster, and GPU allocation 76 llm-d Inference Servers Running inference servers with status and throughput
PROW CI Cards (3)
# Card What it shows 77 PROW CI Monitor Overall PROW health: success rate, job counts (running, pending, failed) 78 PROW Jobs Filterable job list with type, state, PR number, duration, and age 79 PROW History Revision history with pass/fail trends
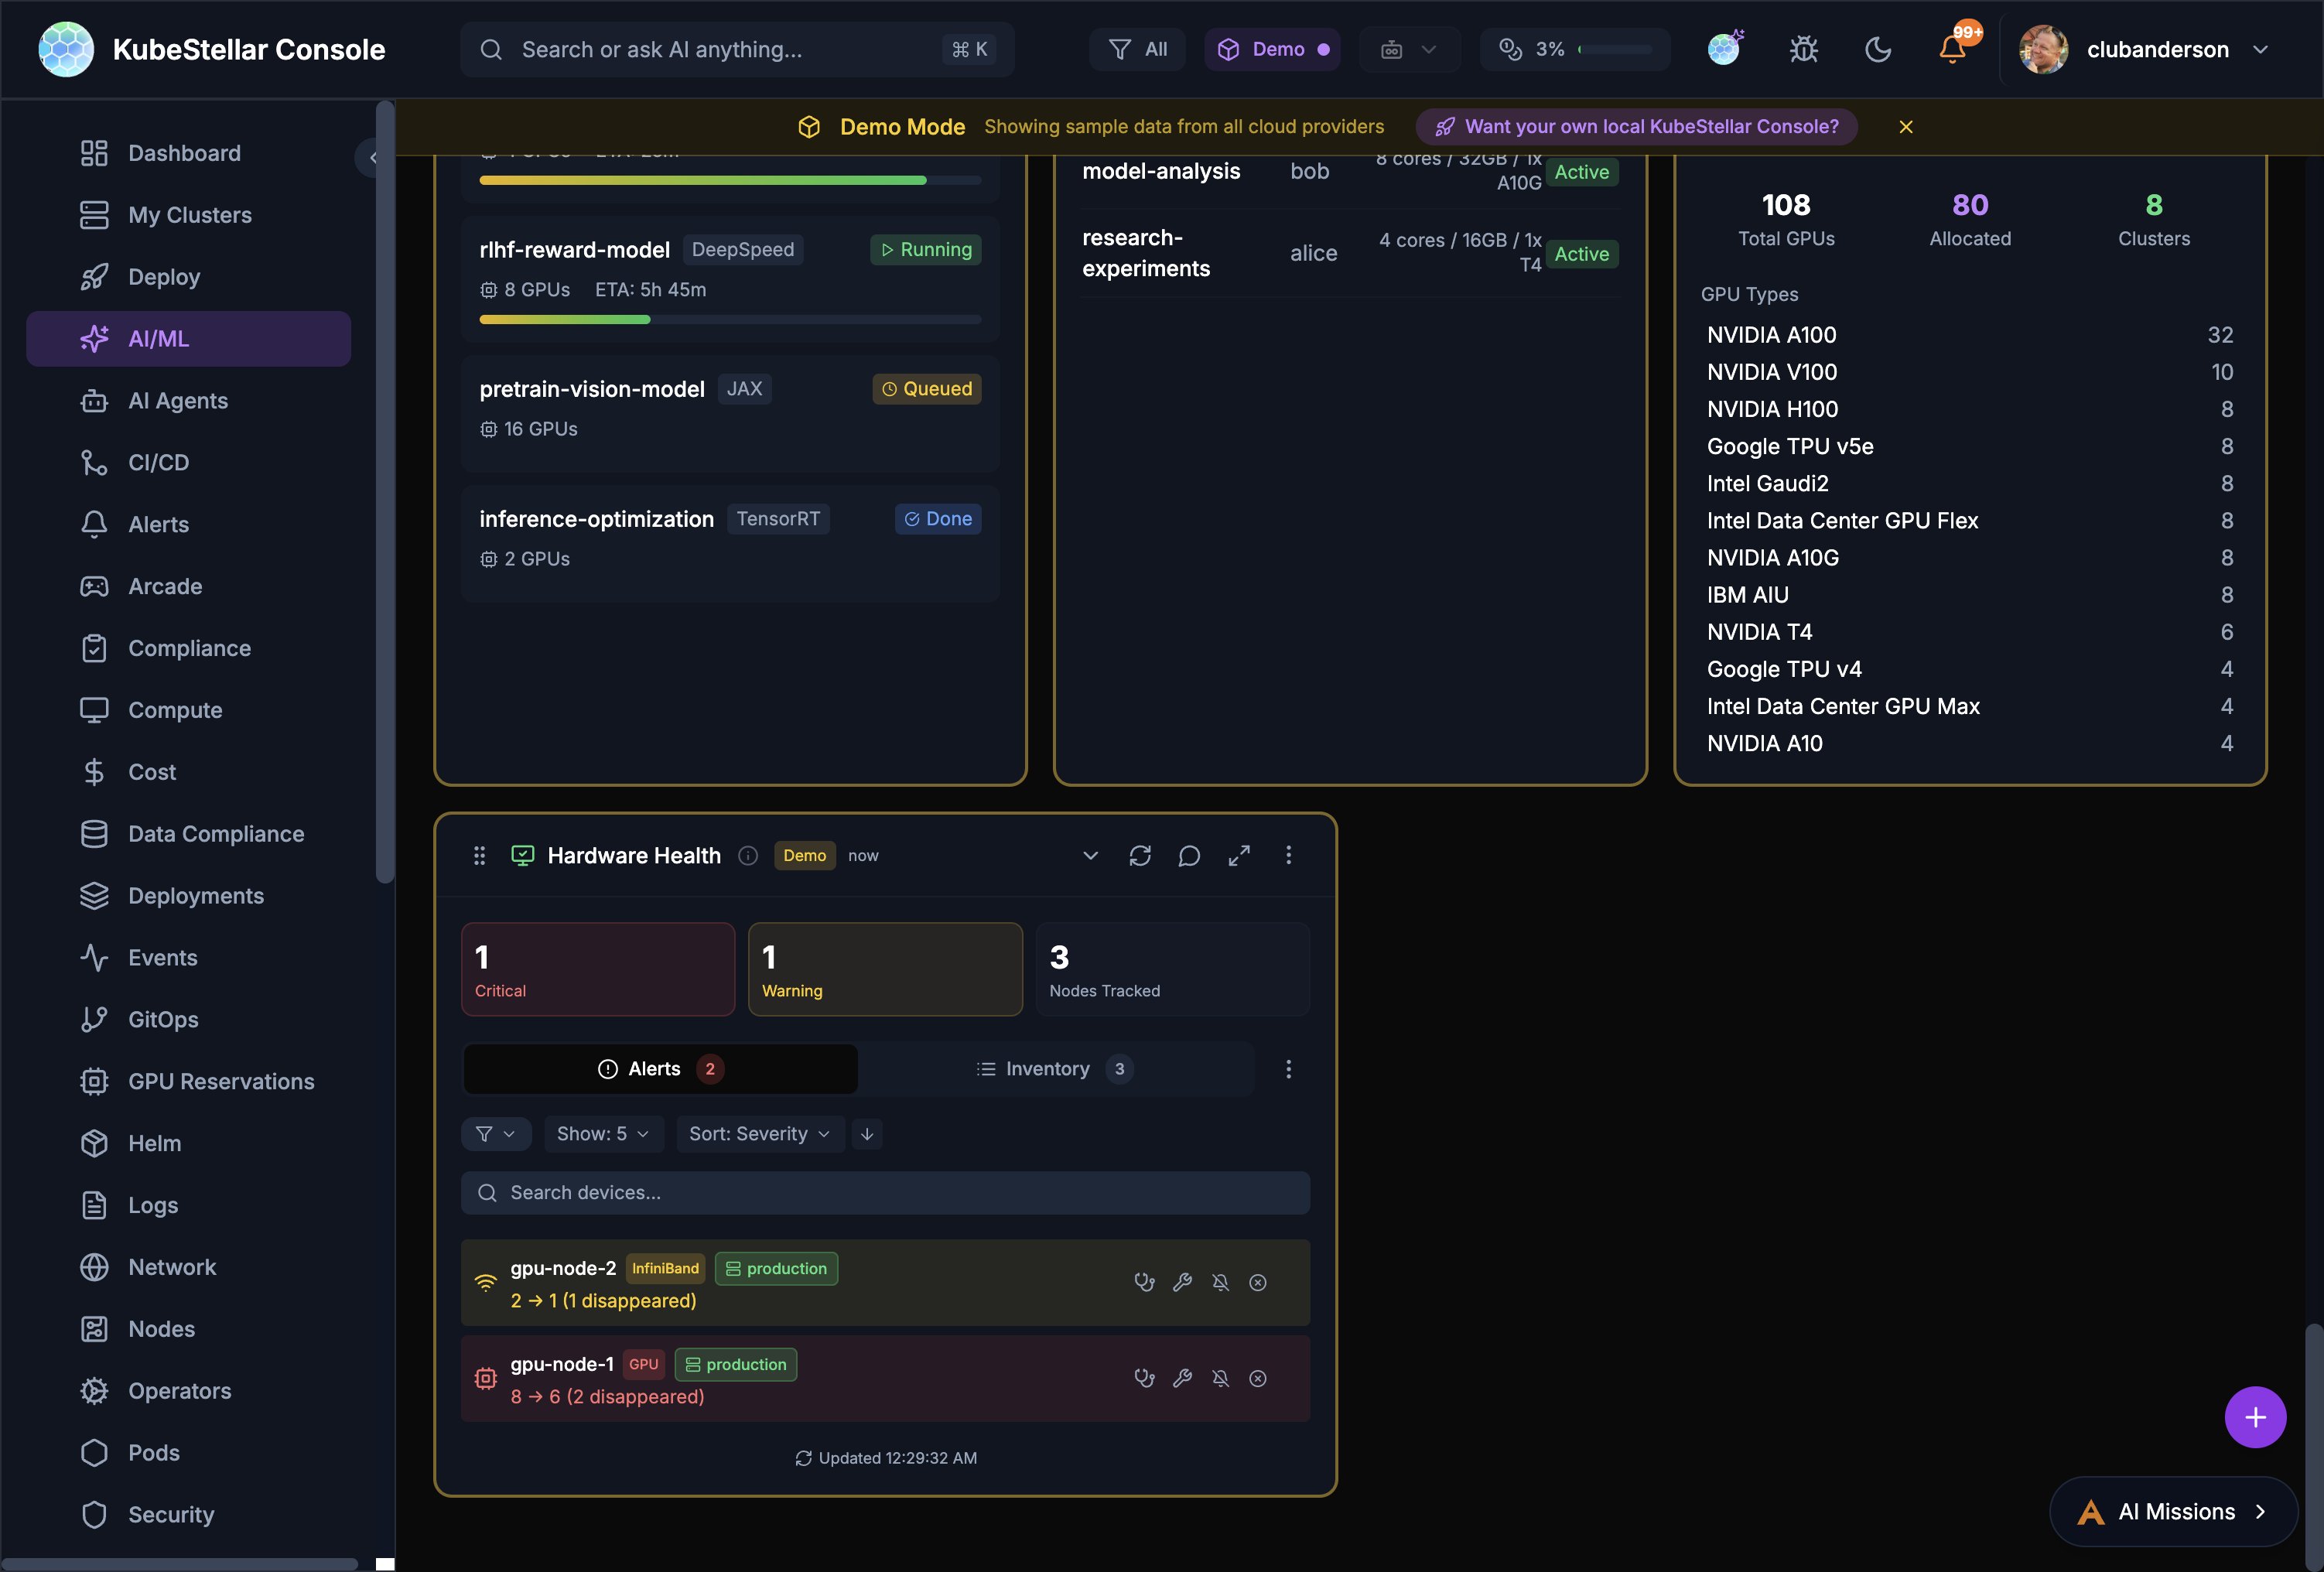
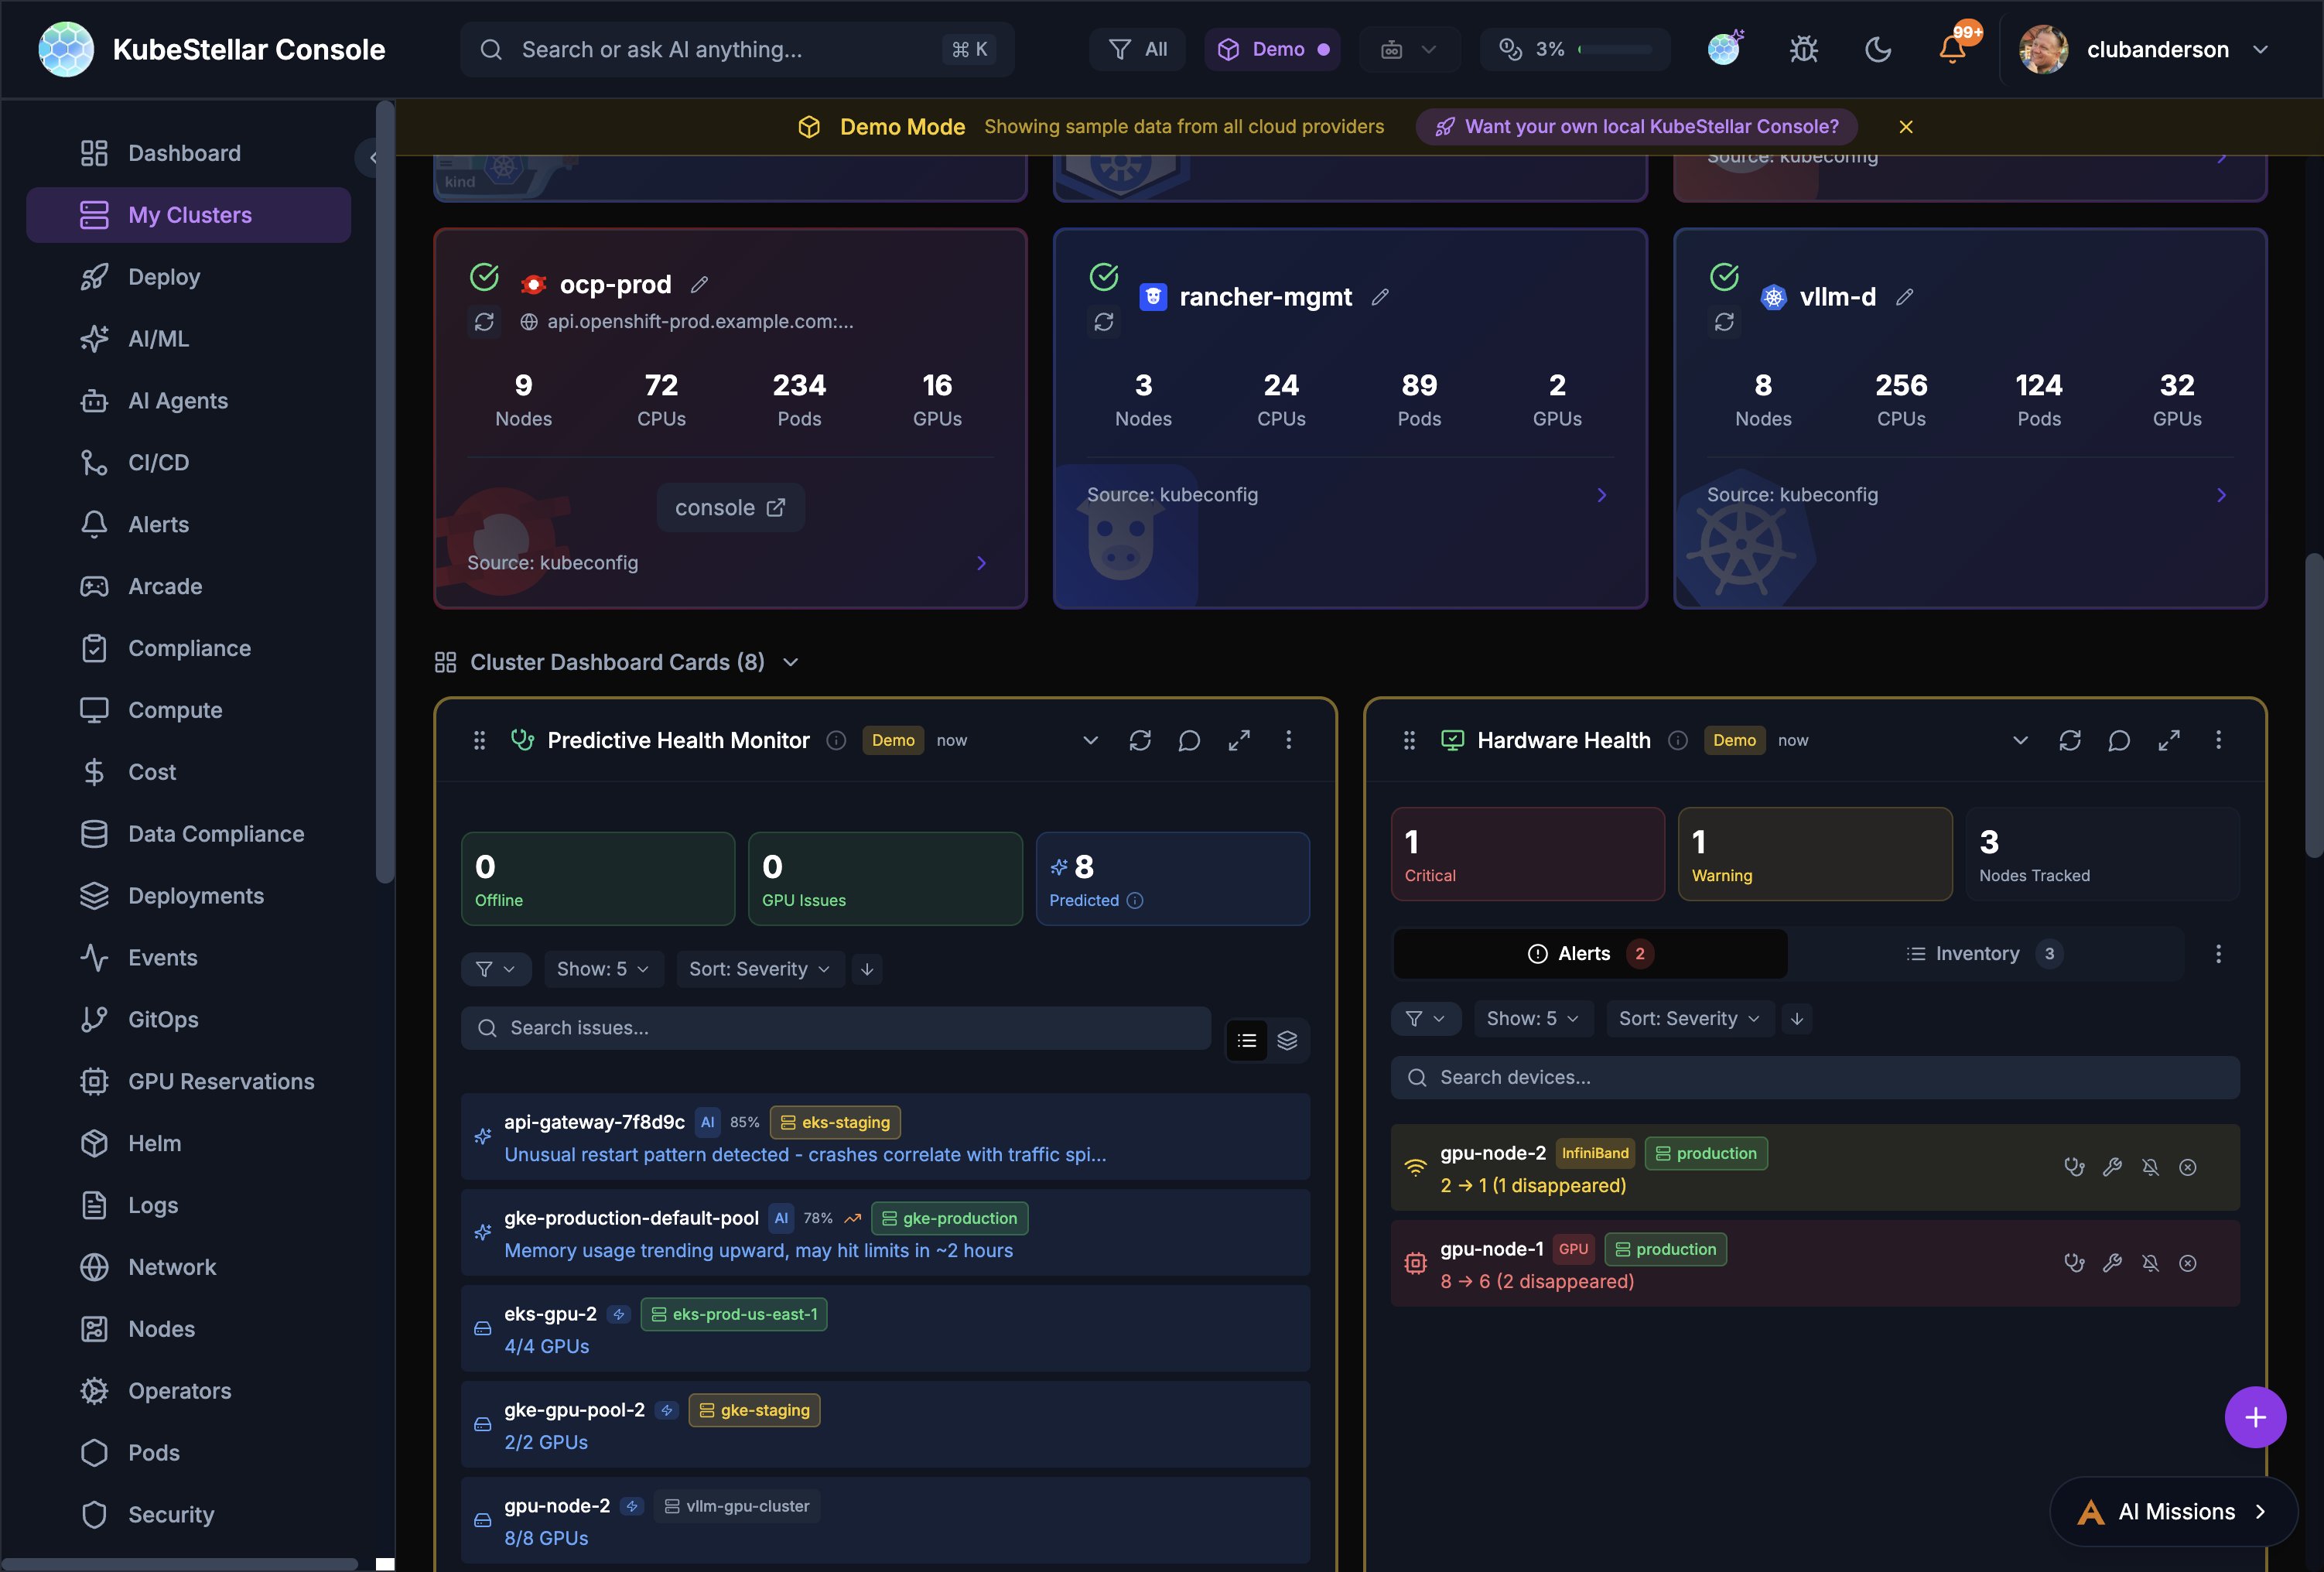
Hardware Health Card (1)
Hardware Health # Card What it shows 80 Hardware Health GPU/accelerator node health with alerts, inventory, IPMI-style monitoring. Shows critical/warning counts, device search, and per-device status with disappearance tracking
Predictive Health Card (1)
Predictive Health Monitor # Card What it shows 81 Predictive Health Monitor AI-powered failure prediction with offline node count, GPU issues, and predicted failures. Shows confidence levels, severity, and correlates with traffic patterns
ML Job & Notebook Cards (2)
# Card What it shows 82 ML Jobs Running ML training jobs (Kubeflow, Ray, custom) with GPU count, ETA, and status 83 ML Notebooks Active Jupyter/notebook servers with user, resources, and status
Kagenti AI Agent Cards (7)
# Card What it shows 84 Kagenti Overview Agent count, MCP tools, builds, framework breakdown (LangGraph, CrewAI, AG2) 85 Agent Fleet Searchable agent list with cluster, framework, replicas, and status 86 Agent Topology Visual topology of agent relationships and dependencies 87 SPIFFE Identity SPIFFE identity coverage and certificate status 88 Agent Builds Build history with status (succeeded, failed, building) 89 Agent MCP Tools MCP tool inventory per agent 90 Agent Logs Aggregated agent logs with filtering
Deploy Cards (5)
# Card What it shows 91 Workloads All workloads with status, drag-to-deploy to cluster groups 92 Cluster Groups Target groups (production, staging, edge) with health 93 Deployment Missions AI-assisted deployment missions with status tracking 94 Resource Marshall Cascading cluster/namespace/workload selector for resource placement 95 Deployment History Timeline of recent deployments with rollback options
GPU Node Health Monitor (1)
# Card What it shows 96 GPU Node Health Monitor Proactive GPU health checks across 4 tiers (Critical, Standard, Full, Deep). CronJob management, per-node results, alert integration, AI Diagnose button
Flatcar Container Linux Card (1)
# Card What it shows 97 Flatcar Container Linux Status Flatcar node count, OS version distribution, update status and health
Nightly E2E Test Cards (1)
# Card What it shows 98 Nightly E2E Status Run history dots (green=pass, red=fail, amber=GPU unavailable, blue=running), per-run metadata, log/artifact links, AI Diagnose on failures
Monitoring Cards (2)
# Card What it shows 99 Thanos Monitoring Status Thanos sidecar, store gateway, compactor, and query health across clusters. Shows component status, replication lag, and query performance 100 wasmCloud Monitoring wasmCloud host status, running actors, capability providers, and lattice health
Card What it shows Crossplane Managed Resources Managed resource count, provider health, composite resource status, resource table with sync/ready status Cloud Native Buildpacks Build counts, success rates, active builders, recent builds with duration and builder info
Additional Cards (44+)
The console includes 44+ additional specialized cards across categories like:
Events - Event timeline and filteringData Compliance - Data classification and compliance checksArcade - 21 Kubernetes-themed games (AI Checkers, Kube Chess, Container Tetris, etc.)Card History - Track card changes over timeUser Management - Console user managementWeather, Stocks, RSS - Widget-style cards for external data
Plus any custom cards you create using the Card Factory .
Visualization Types
Cards use different ways to show data:
Type Icon What it looks like Gauge ⏱️ Circular progress indicator Table 📋 Rows and columns of data Timeseries 📈 Line chart over time Events 📜 Scrolling event feed Donut 🍩 Pie/donut chart Bar 📊 Bar chart Status 🚦 Status indicators (green/yellow/red)
Adding Cards
Click the Add Card button
Browse by category or search
Click a card to add it
Drag it where you want
Click the menu to configure it
Creating Custom Cards (Card Factory)
Don’t see the card you need? Create your own:
Open the Card Factory
Choose your method:
AI-Assisted - Describe what you want in plain EnglishJSON - Write a declarative card definitionTSX Code - Write a React component (compiled at runtime)
Preview your card
Add it to any dashboard
Configuring Cards
Click the menu (three dots) on any card:
Configure - Change settings like filters, refresh intervalReplace - Swap for a different card typeRemove - Take it off your dashboard
Common Configuration Options
Clusters - Show data from specific clustersNamespaces - Filter to specific namespacesRefresh interval - How often to updateShow count - How many items to display
AI Card Suggestions
In High AI mode, the console watches what you look at and suggests new cards:
AI notices you’re focusing on pods
It suggests adding the Pod Issues card
You can Accept, Snooze (1 hour), or Dismiss
This helps your dashboard evolve with your needs!