KubeStellar Console Features
This guide covers the main features of the KubeStellar Console.
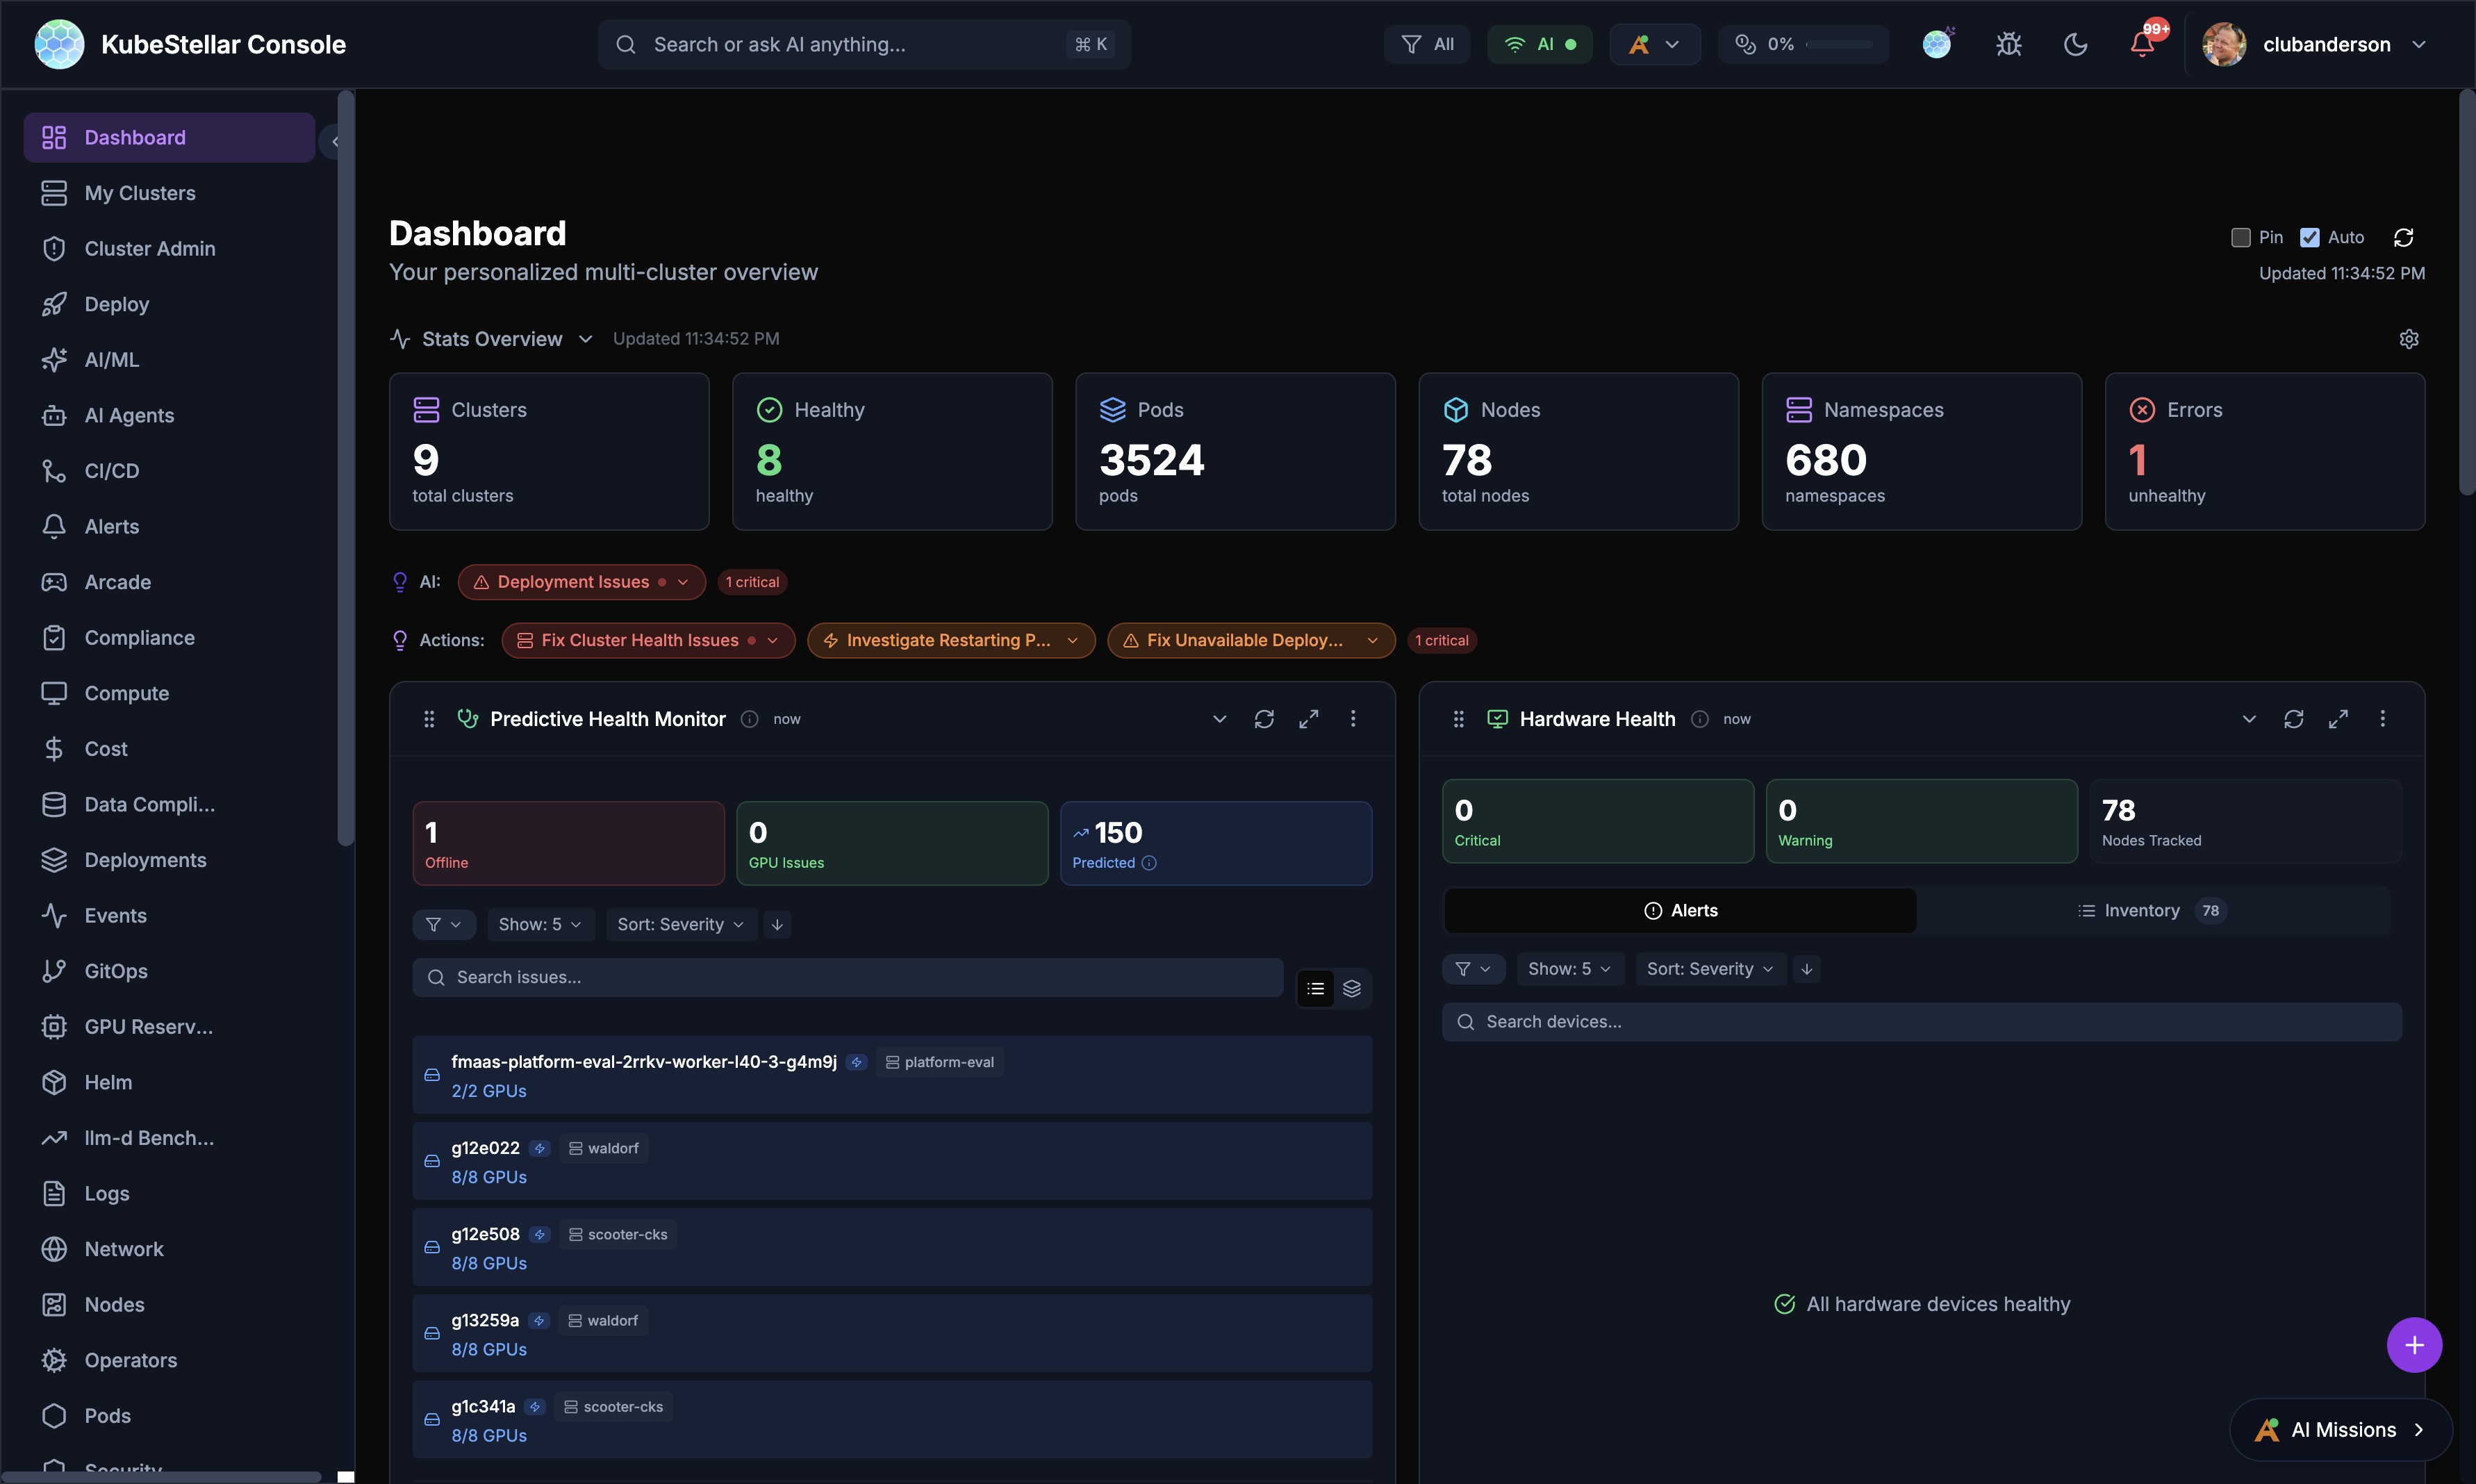
Dashboard
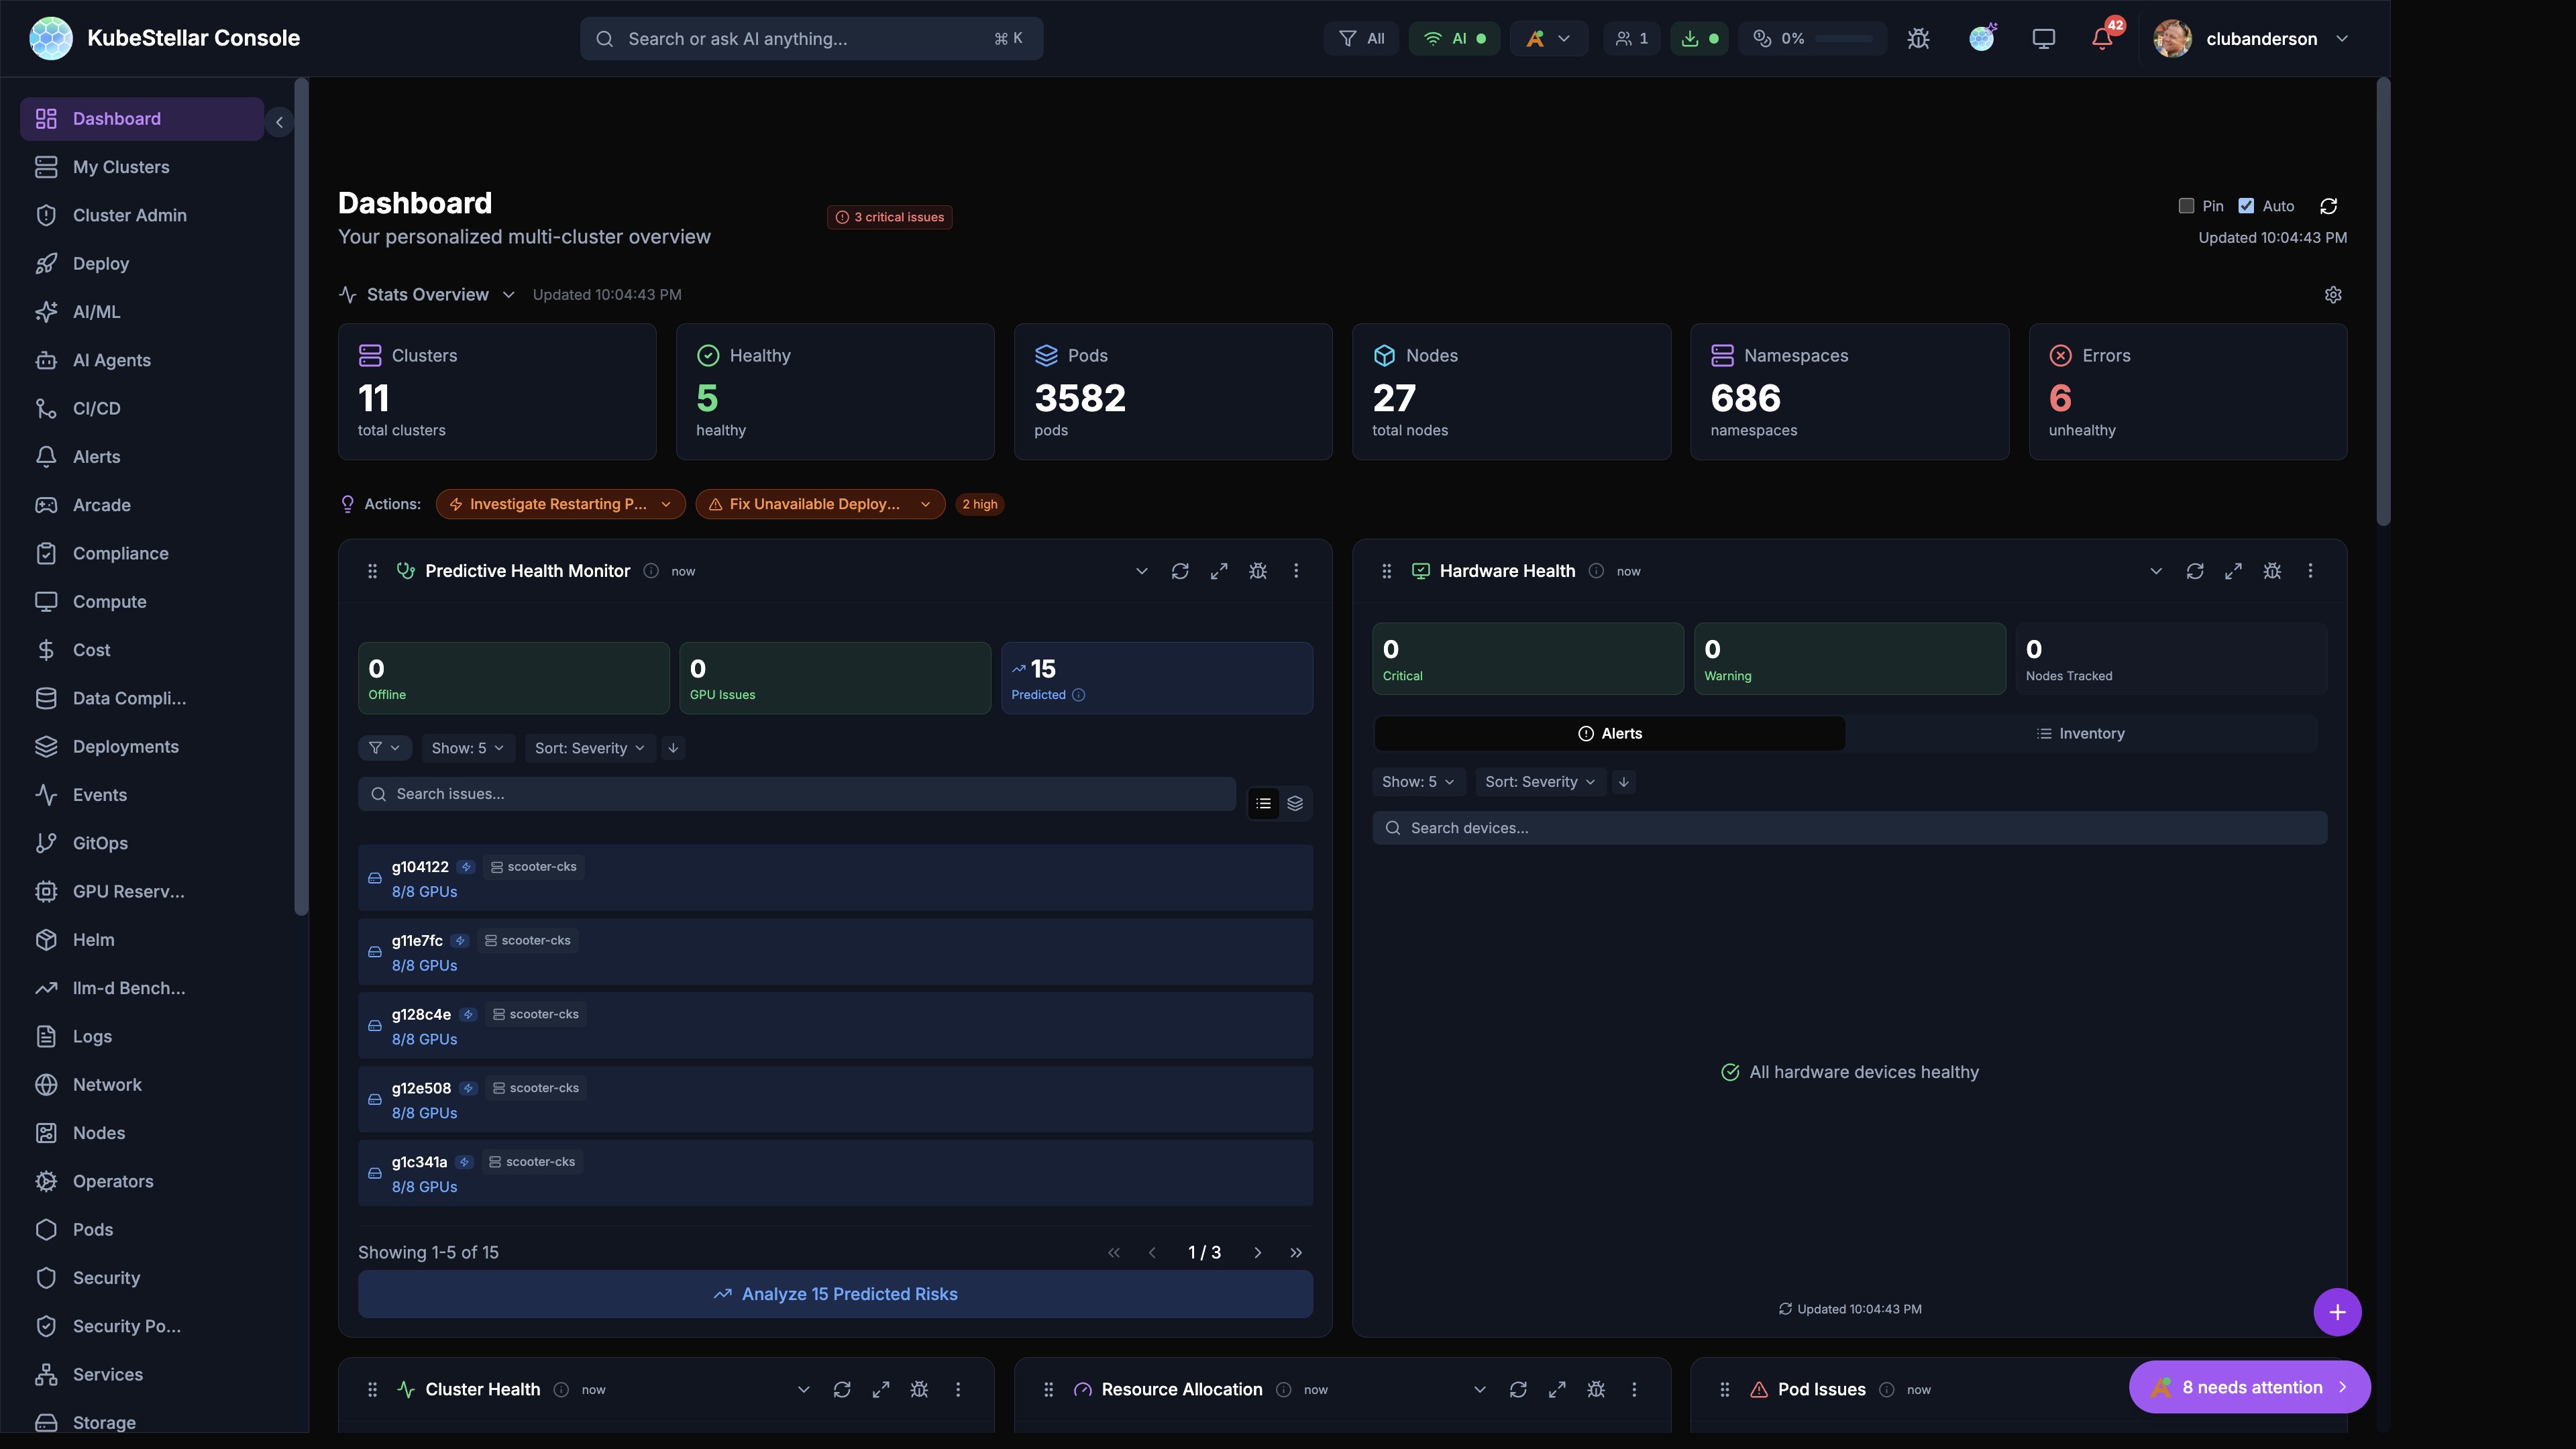
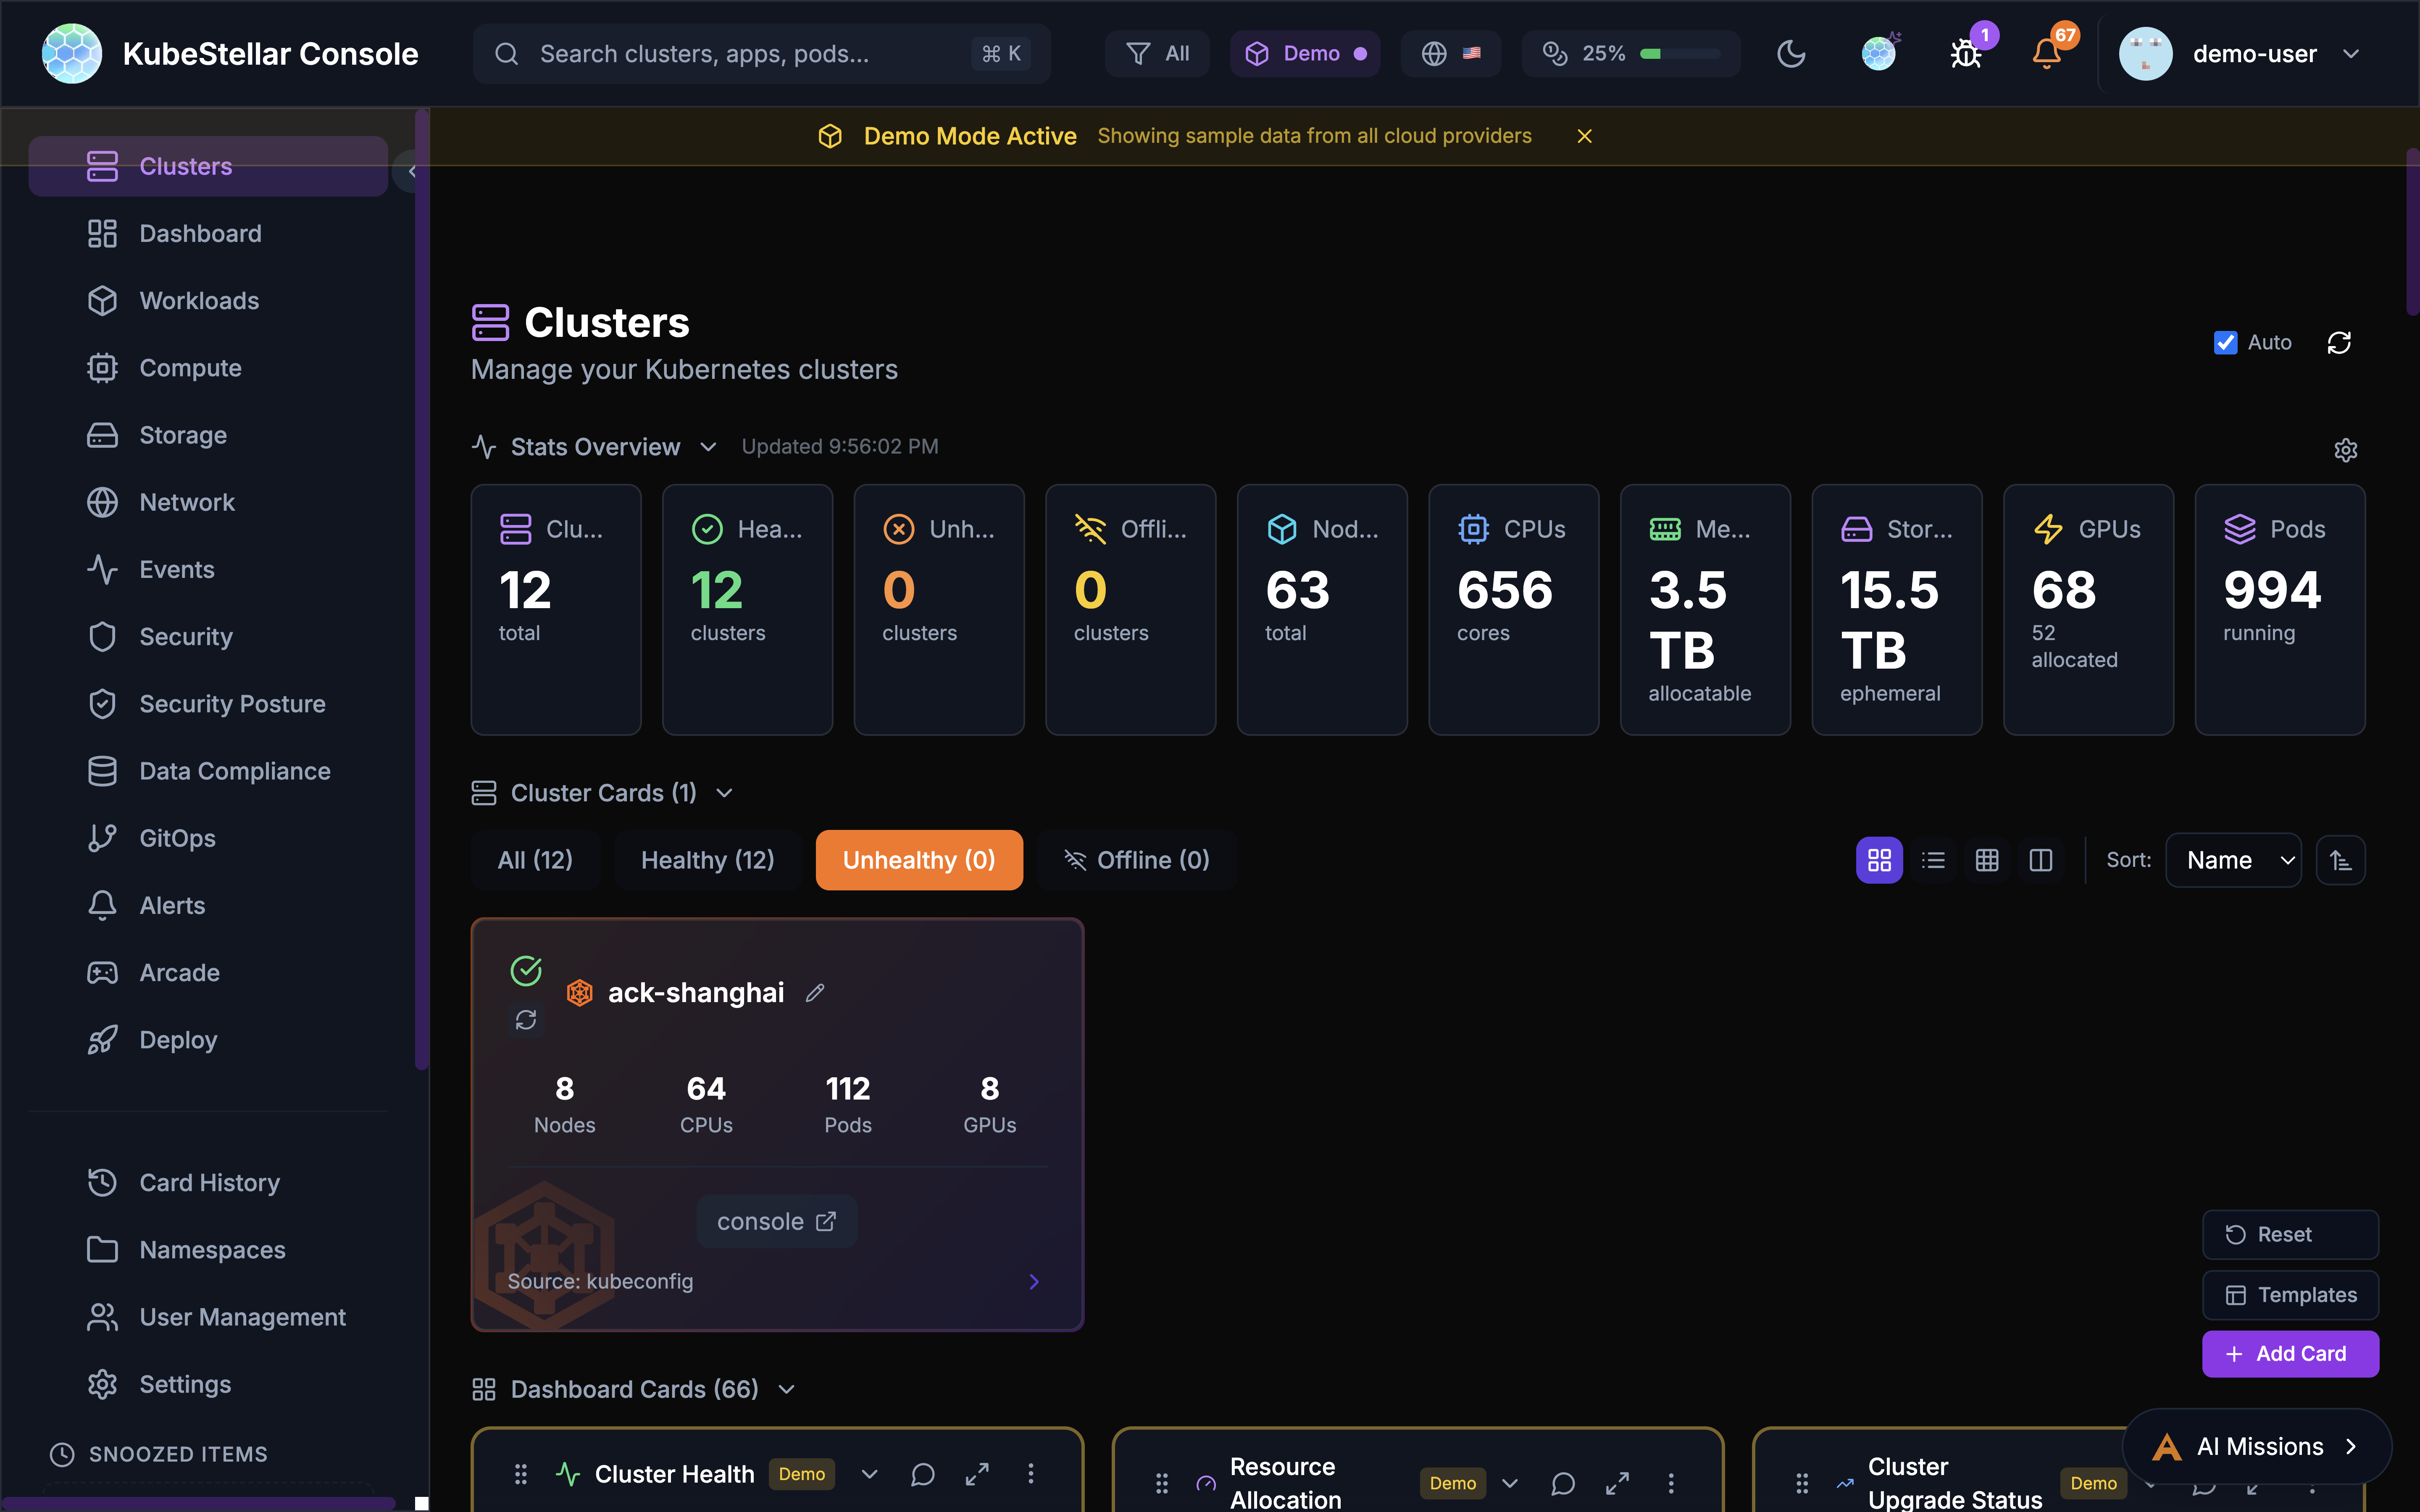
The main dashboard provides a customizable view of your multi-cluster environment.
Stats Overview
The stats bar at the top of the dashboard displays key metrics with auto-scaling number formatting:
- Clusters: Total cluster count and health status
- Healthy: Number of healthy clusters
- Pods: Total pod count (auto-scales to
3.5Kfor large counts) - Nodes: Total nodes across all clusters
- Namespaces: Total namespace count
- Errors: Count of unhealthy resources with drill-down links
Dashboard Cards
Cards are the building blocks of the dashboard. Each card displays specific information about your clusters:
- Drag cards to reorder them
- Resize cards by adjusting their width
- Collapse cards to save space
- Use the AI button to get insights about card data
Dashboard Templates
Pre-configured dashboard layouts for common use cases:
- Operations: Cluster health, deployments, events
- GPU Monitoring: GPU utilization, workloads, trends
- Security: OPA policies, alerts, vulnerabilities
- GitOps: Helm releases, drift detection, sync status
Settings
The settings page allows you to configure all aspects of the console.
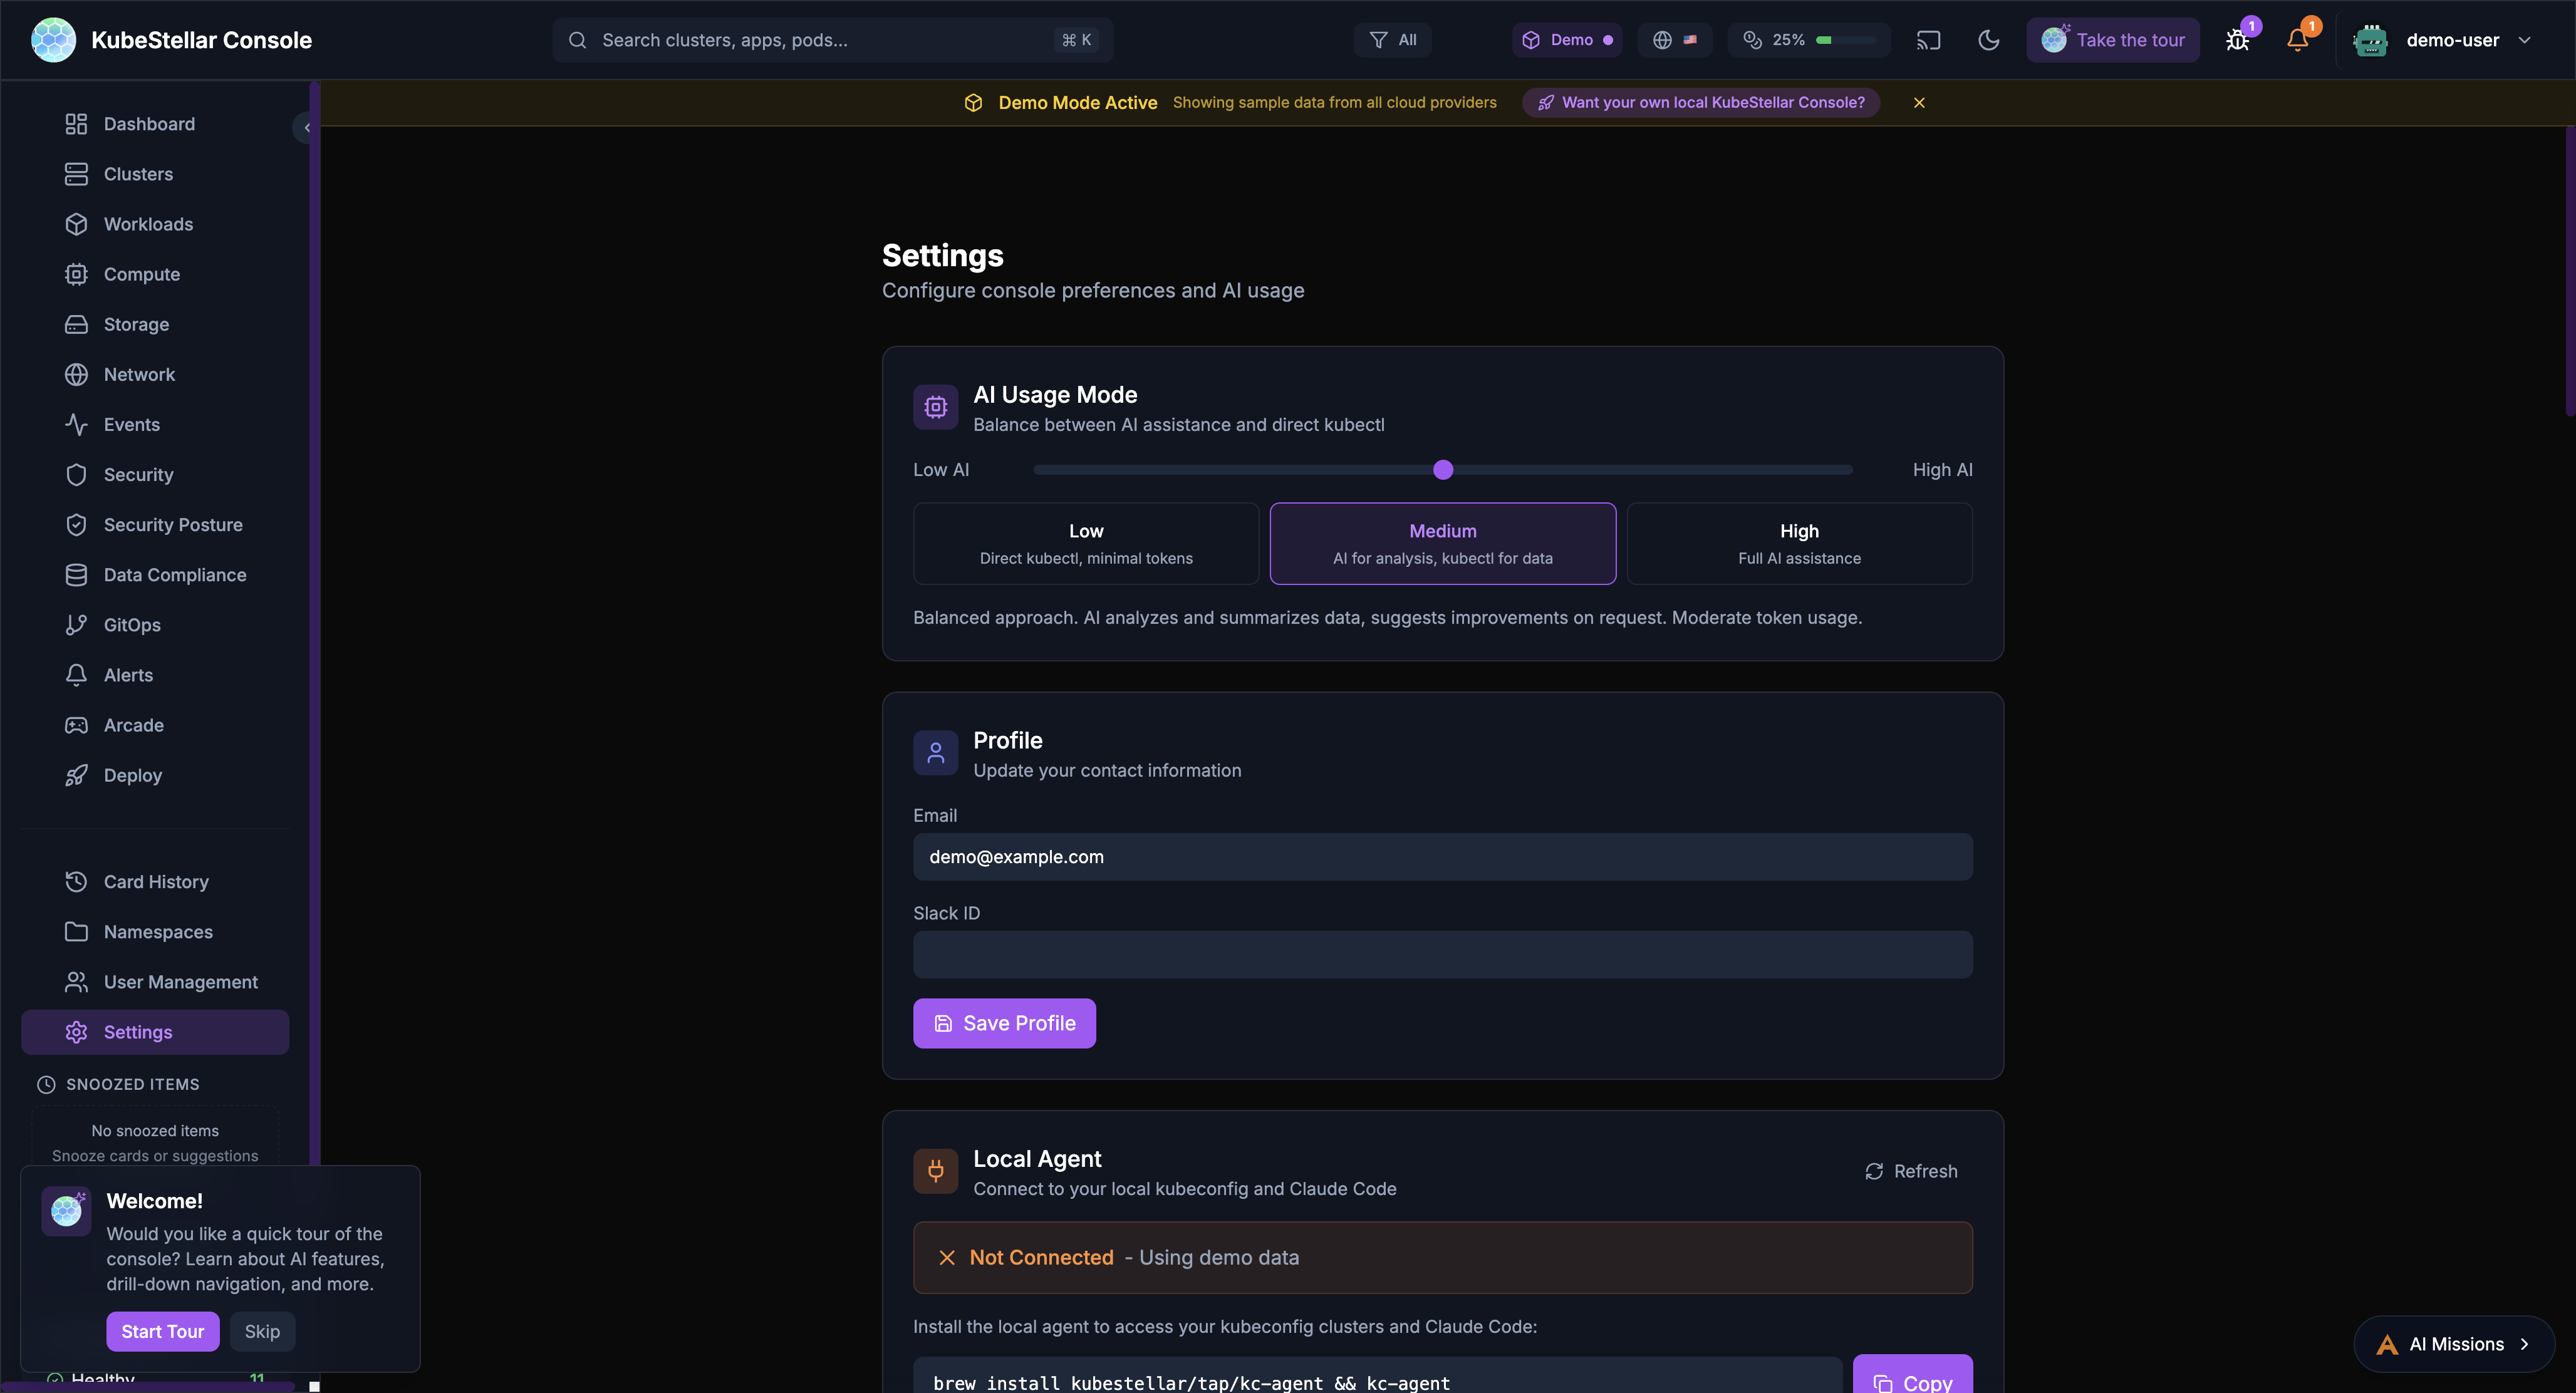
AI Usage Mode
Control how much AI assistance you receive:
- Low: Direct kubectl commands, minimal token usage
- Medium: AI for analysis and suggestions
- High: Full AI assistance for all operations
Local Agent
Connect to your local kubeconfig and Claude Code:
- View agent version and connection status
- See connected clusters
- Monitor token usage (session, daily, monthly)
Update Channels
Choose your release channel:
- Stable (Weekly): Tested releases every week
- Nightly: Latest features, updated daily
Appearance
Customize the look and feel:
- Multiple themes: KubeStellar, Batman, Dracula, Nord, Tokyo Night, Cyberpunk, Matrix
- Visual effects: star field, glow effects, gradients
- Accessibility: color blind mode, reduce motion, high contrast
Token Usage
Monitor and limit AI token consumption:
- Set monthly token limits
- Configure warning and critical thresholds
- Reset usage counters
Navigation
The sidebar provides access to all major sections:
Primary Navigation
- Dashboard: Main multi-cluster overview
- Clusters: Detailed cluster management
- Workloads: Deployments, pods, and jobs
- Compute: CPU, memory, and GPU resources
- Storage: Persistent volumes and claims
- Network: Services, ingresses, and network policies
- Events: Kubernetes event stream
- Security: Security posture and alerts
- GitOps: Helm, Kustomize, and ArgoCD
Secondary Navigation
- Card History: Previously viewed cards
- Namespaces: Namespace-specific views
- User Management: RBAC and access control
- Settings: Console configuration
Special Sections
- Arcade: Games and entertainment
- Deploy: Multi-cluster deployment tools
Search
The global search bar (Cmd/Ctrl + K) enables quick navigation:
- Search clusters by name
- Find applications and pods
- Navigate to specific namespaces
- Filter by resource type
Alerts
The alert system keeps you informed:
- Real-time notifications for critical events
- Configurable alert rules
- Integration with external notification systems
- Alert history and acknowledgment
AI Missions
AI-powered automation for common tasks:
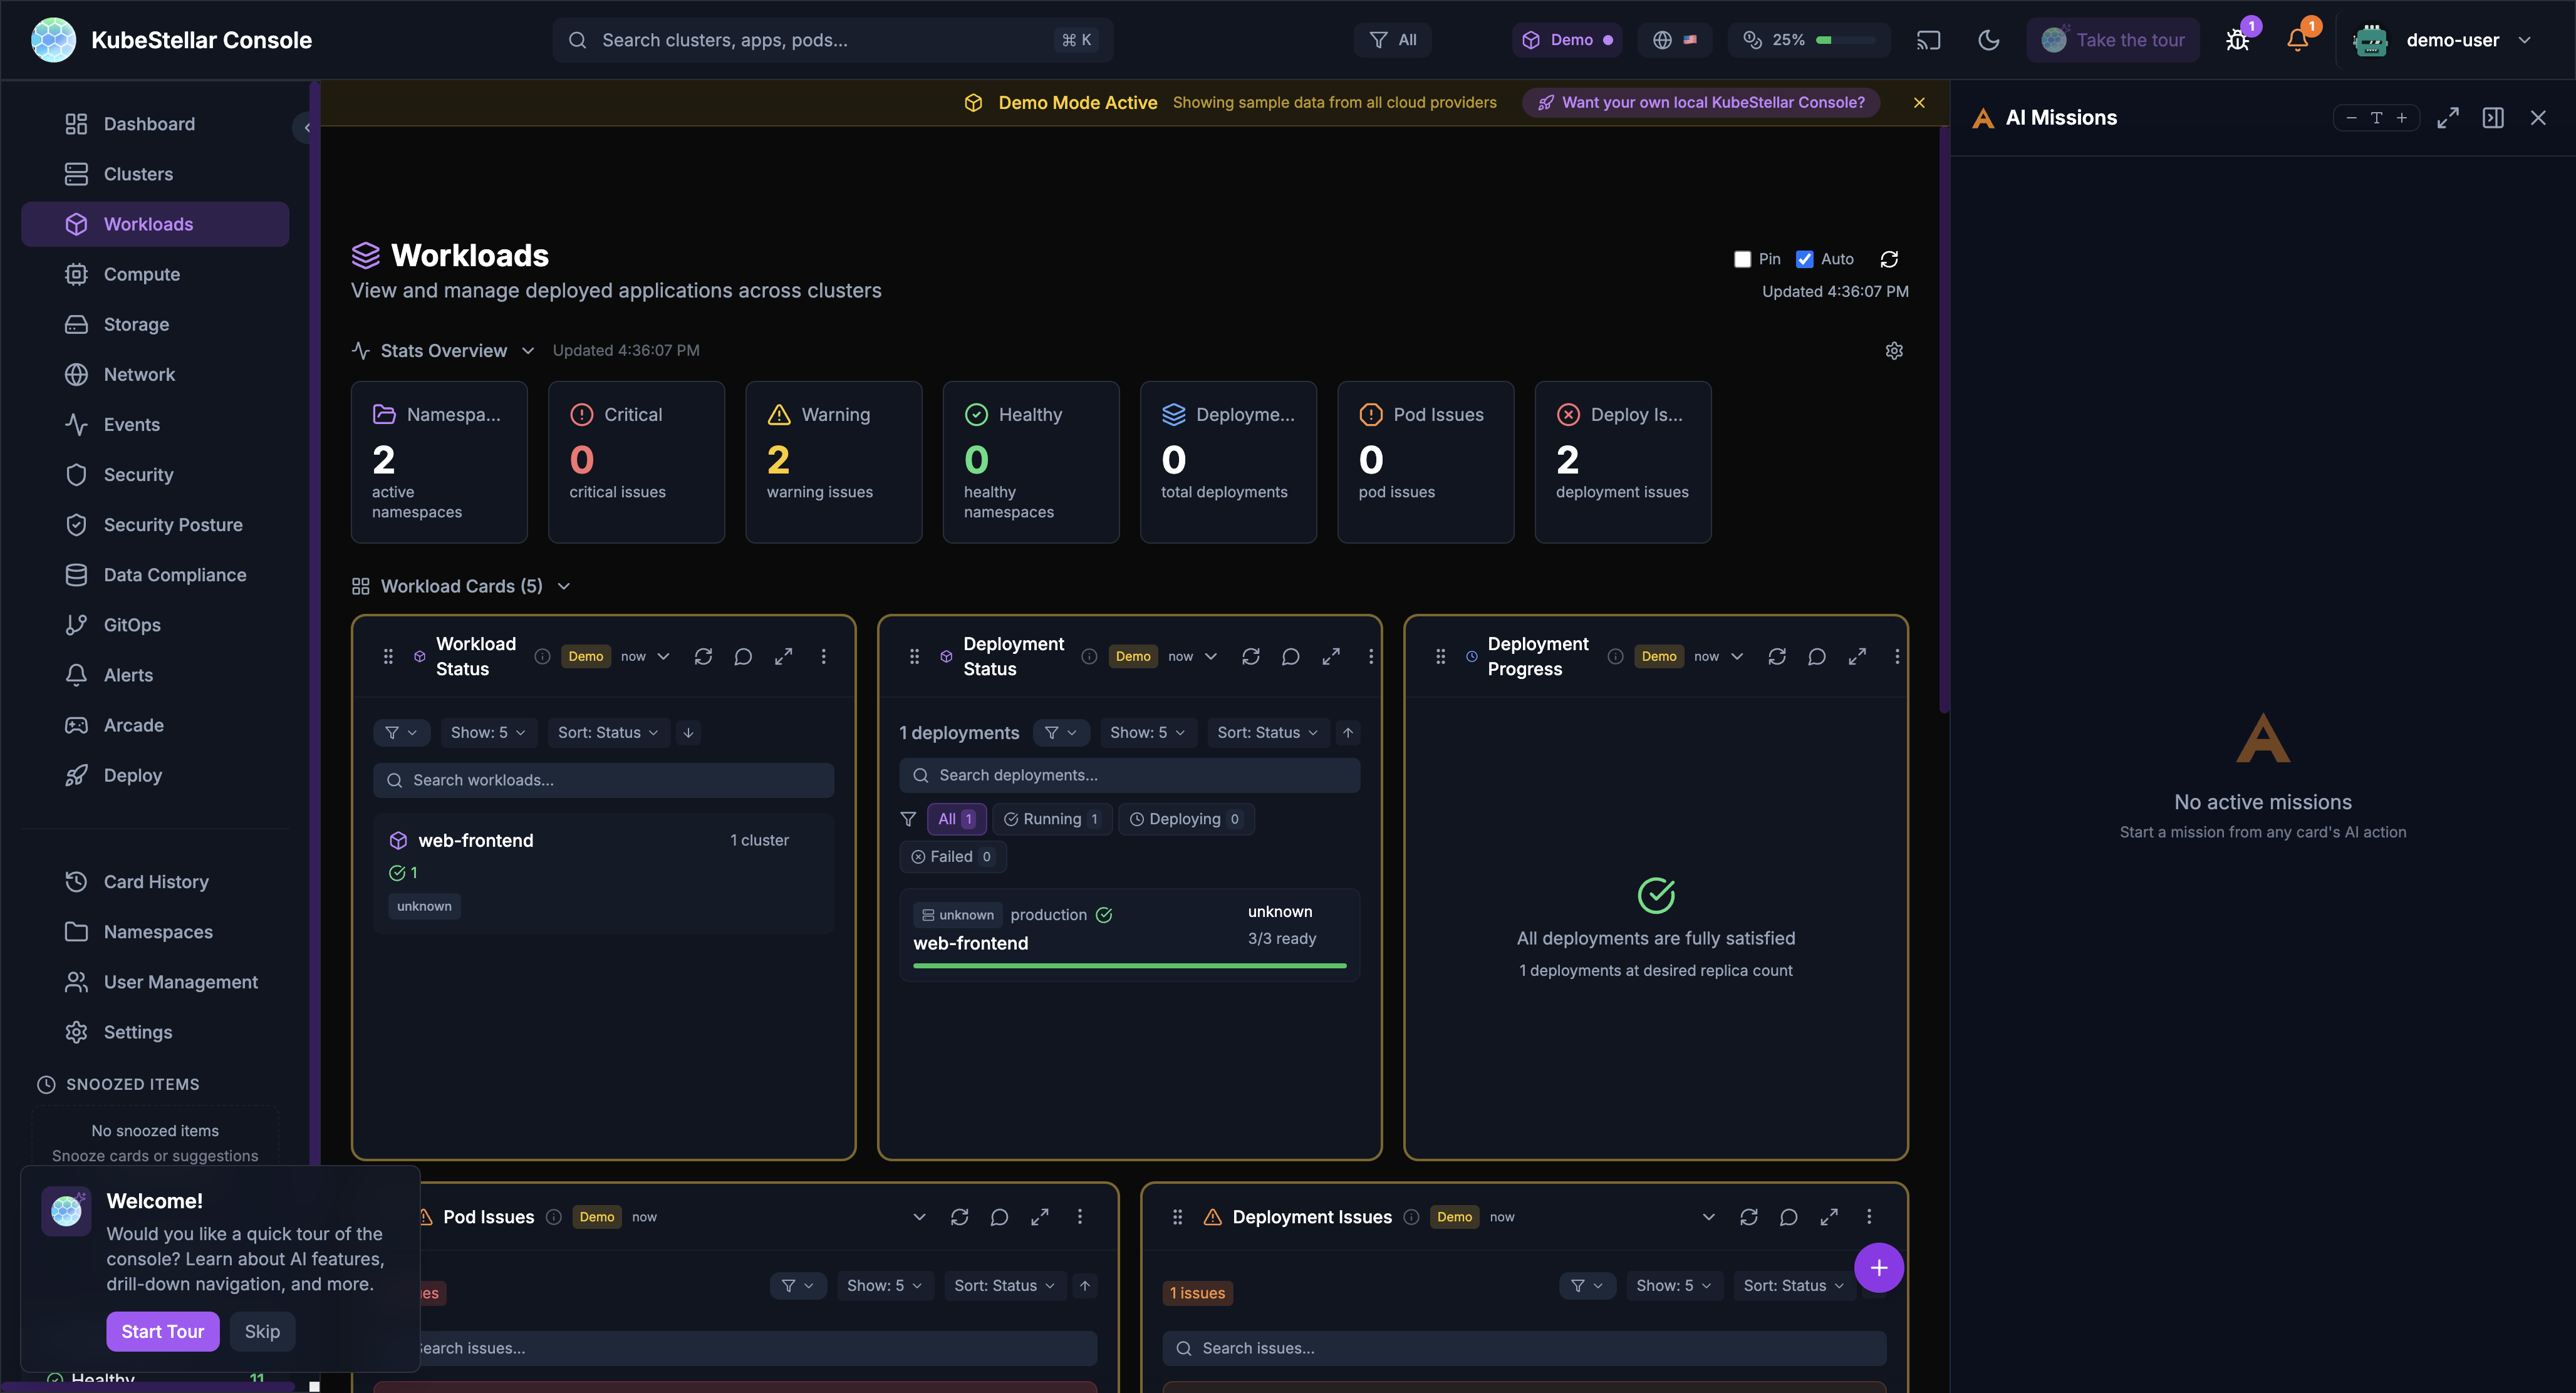
Starting a Mission
Missions can be started from:
- Card AI buttons: Click the AI icon on any card
- Stats bar actions: Click “Address Security Issues” or similar action buttons
- Keyboard shortcut: Press
Mto open the missions panel
Mission Types
- Security Analysis: Investigate security issues and vulnerabilities
- Performance Investigation: Analyze slow pods or resource constraints
- Troubleshooting: Debug failing deployments or pods
- Remediation: Apply fixes for common problems
AI Provider Configuration
The console supports multiple AI backends:
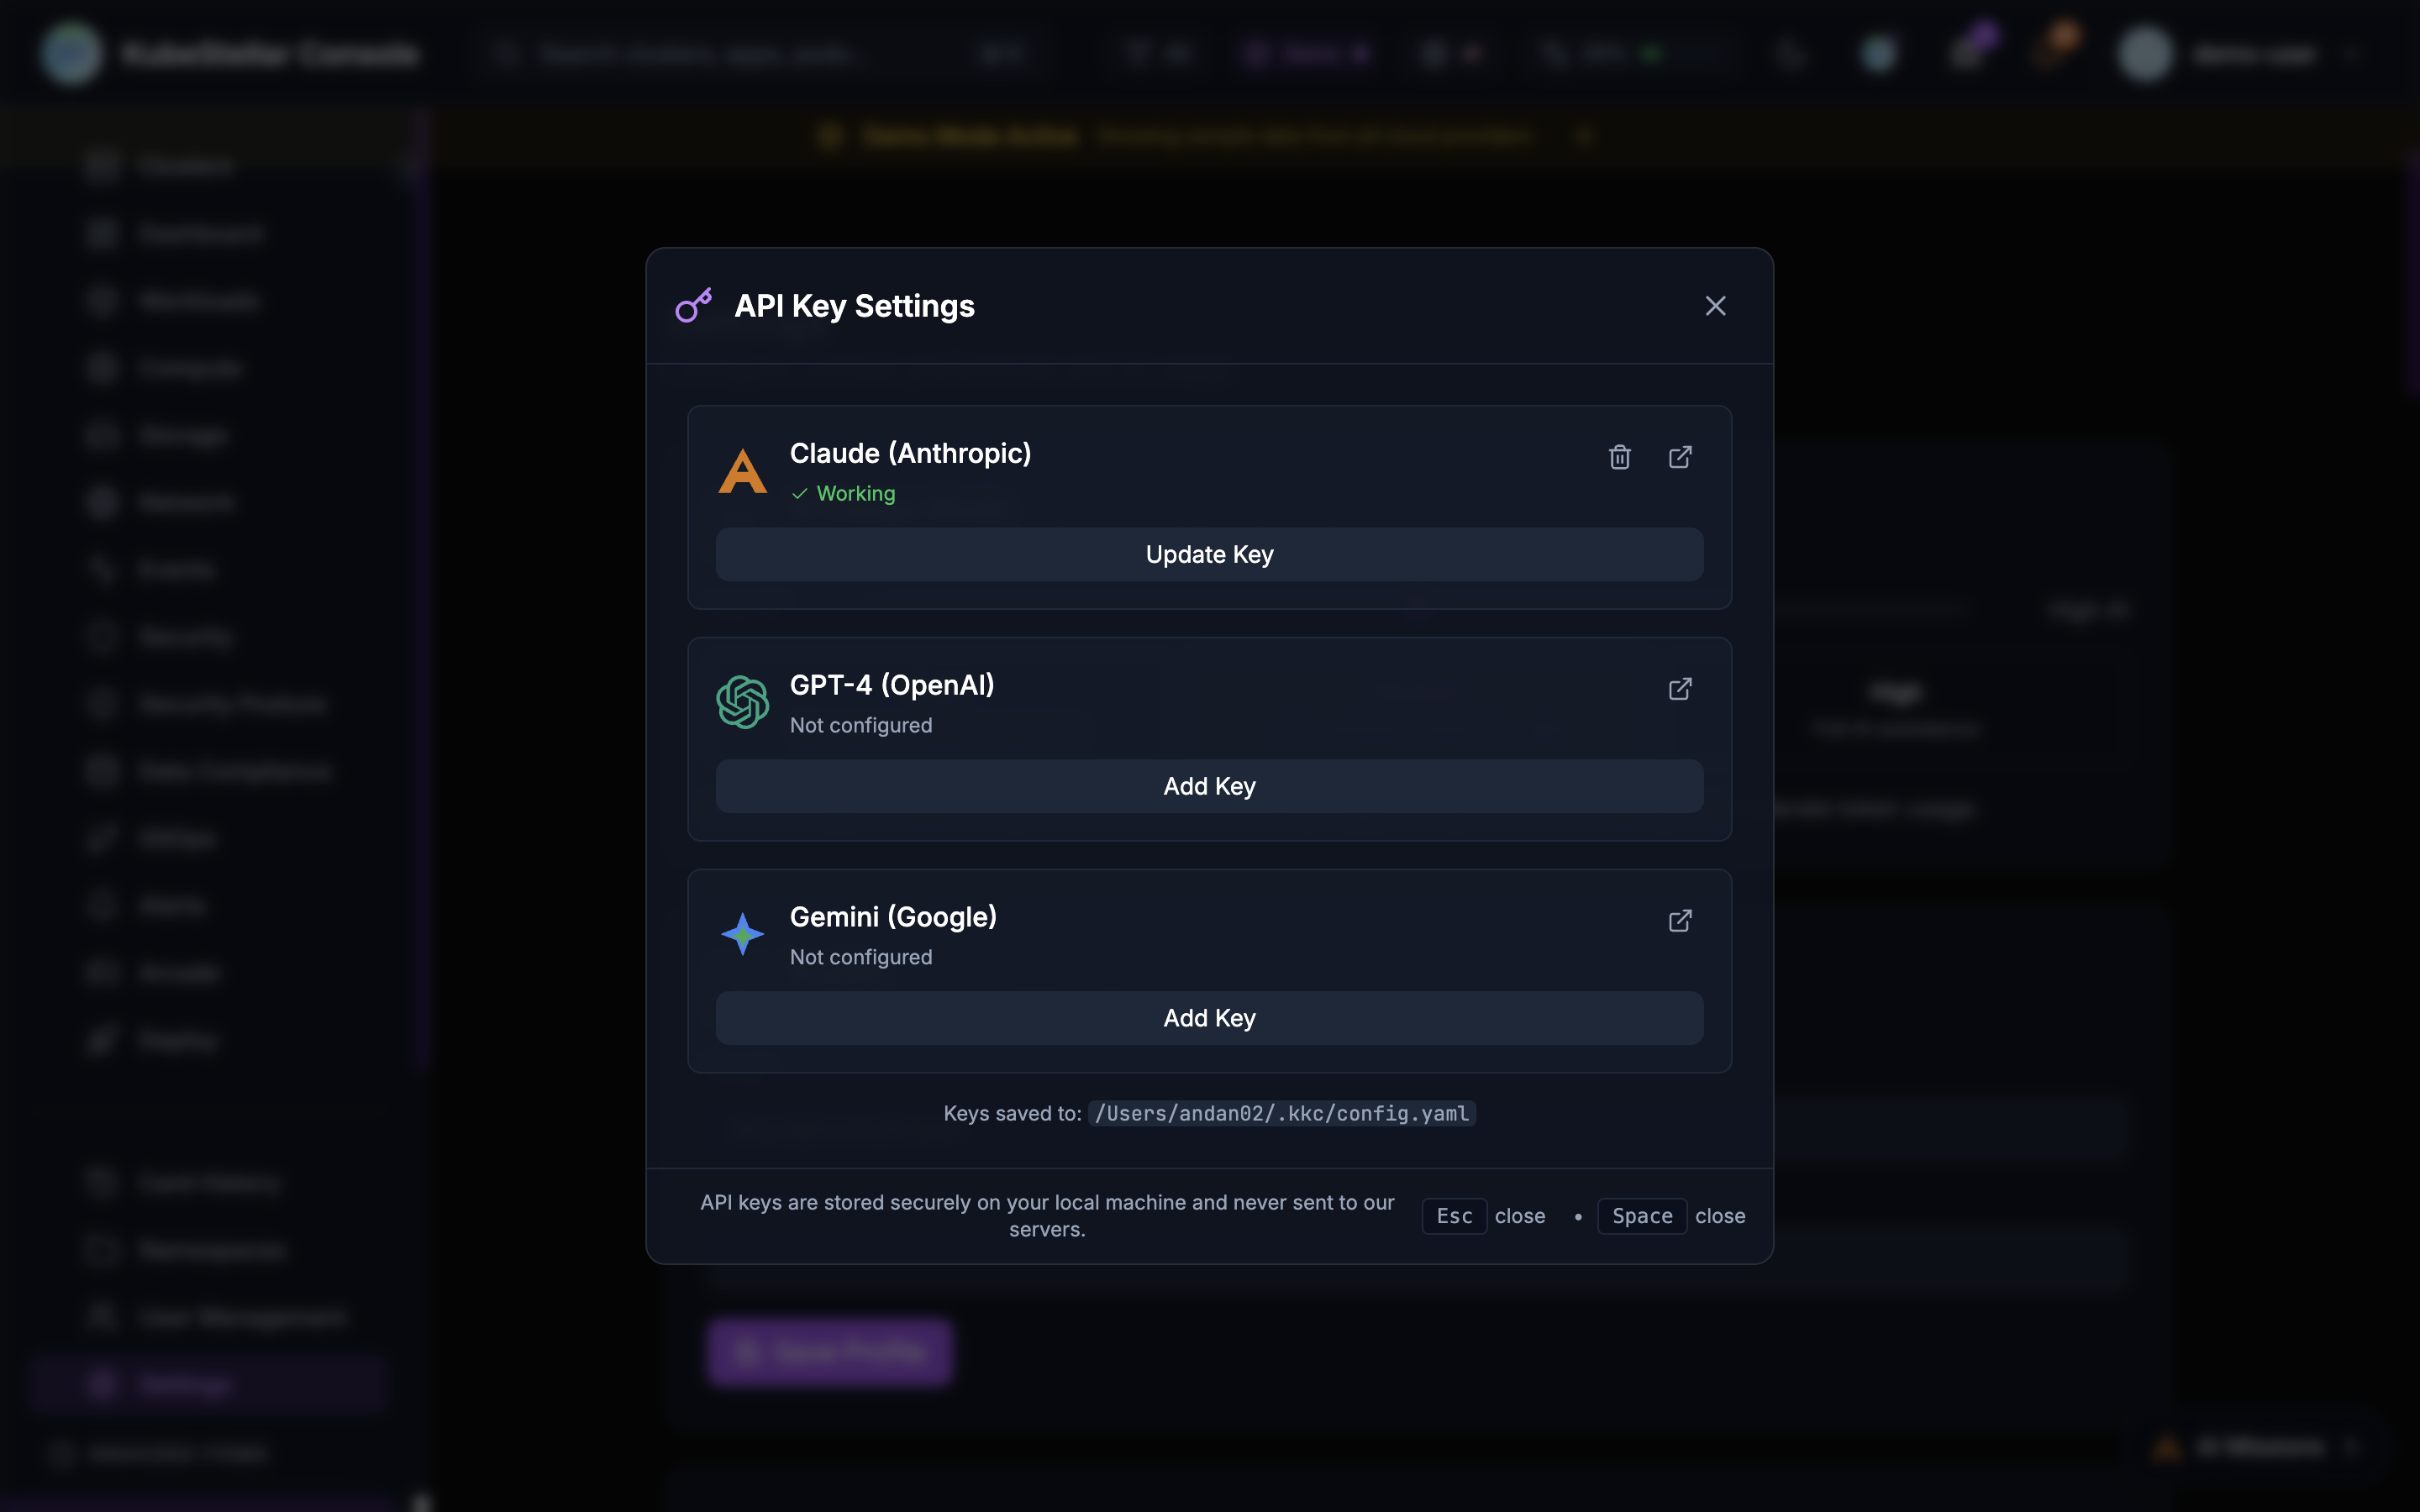
- Claude (Anthropic): Primary AI backend with API access
- Claude Code (Local): Uses your local Claude Code installation for missions
- GitHub Copilot CLI: Uses Copilot CLI for agent tasks
- GPT-4 (OpenAI): Alternative LLM backend
- Gemini (Google): Alternative LLM backend
Configure API keys in Settings > AI Provider Keys or click the key icon in the header.
Offline Detection & Predictive Health
The console includes both reactive offline detection and AI-powered predictive failure detection.
Node Offline Detection
- Node Monitoring: Detects nodes with NotReady status
- GPU Tracking: Identifies GPU nodes reporting 0 available GPUs
- Health Summary: Shows count of offline nodes and GPU issues
- AI Analysis: Click “Analyze Issues” to start an AI mission investigating problems
Predictive Failure Detection
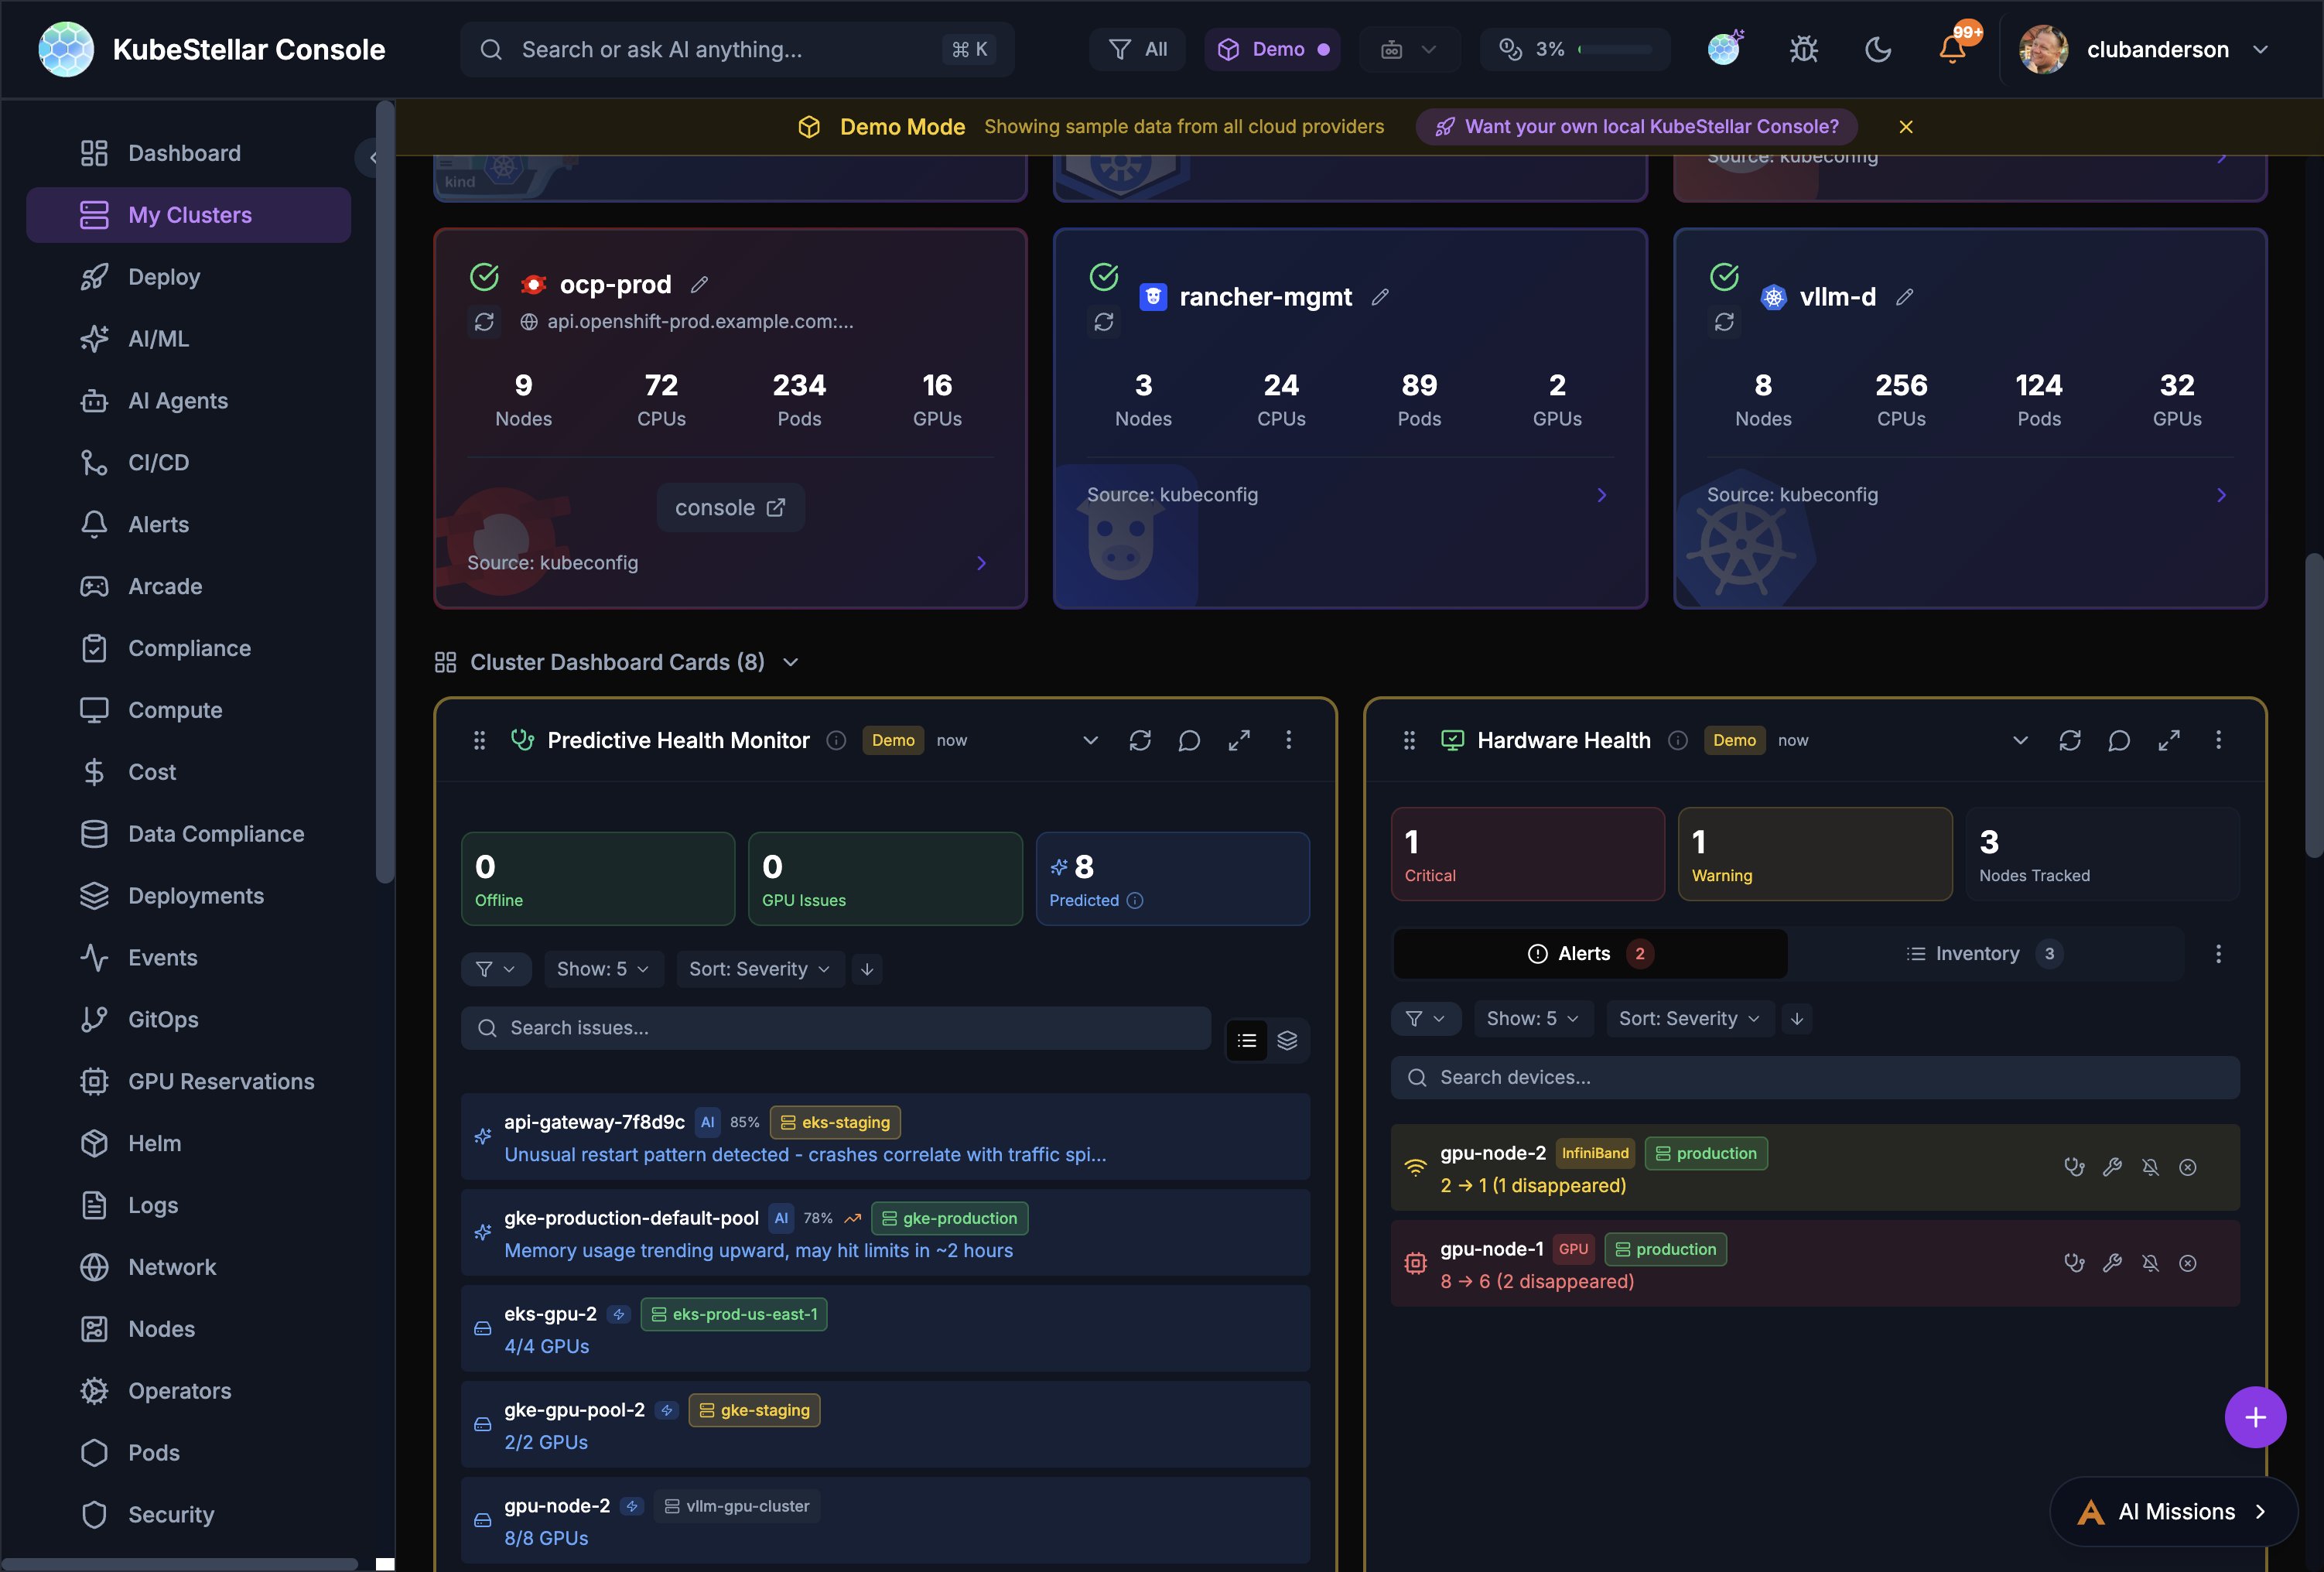
AI analyzes cluster data to predict failures before they happen:
- Pattern Recognition: Detects anomalous CPU, memory, disk, and network patterns
- Confidence Levels: Each prediction shows a confidence percentage
- Root Cause Analysis (RCA): AI explains why a failure is likely, correlating symptoms with known patterns
- Configurable Thresholds: Adjust analysis interval (15 min - 2 hours) and minimum confidence (50% - 90%)
- Multi-Provider Consensus: Optionally run predictions across multiple AI providers for higher accuracy
Configure in Settings > AI & Intelligence > Predictions.
Hardware Health
The Hardware Health card provides IPMI-style monitoring for GPU and accelerator nodes:
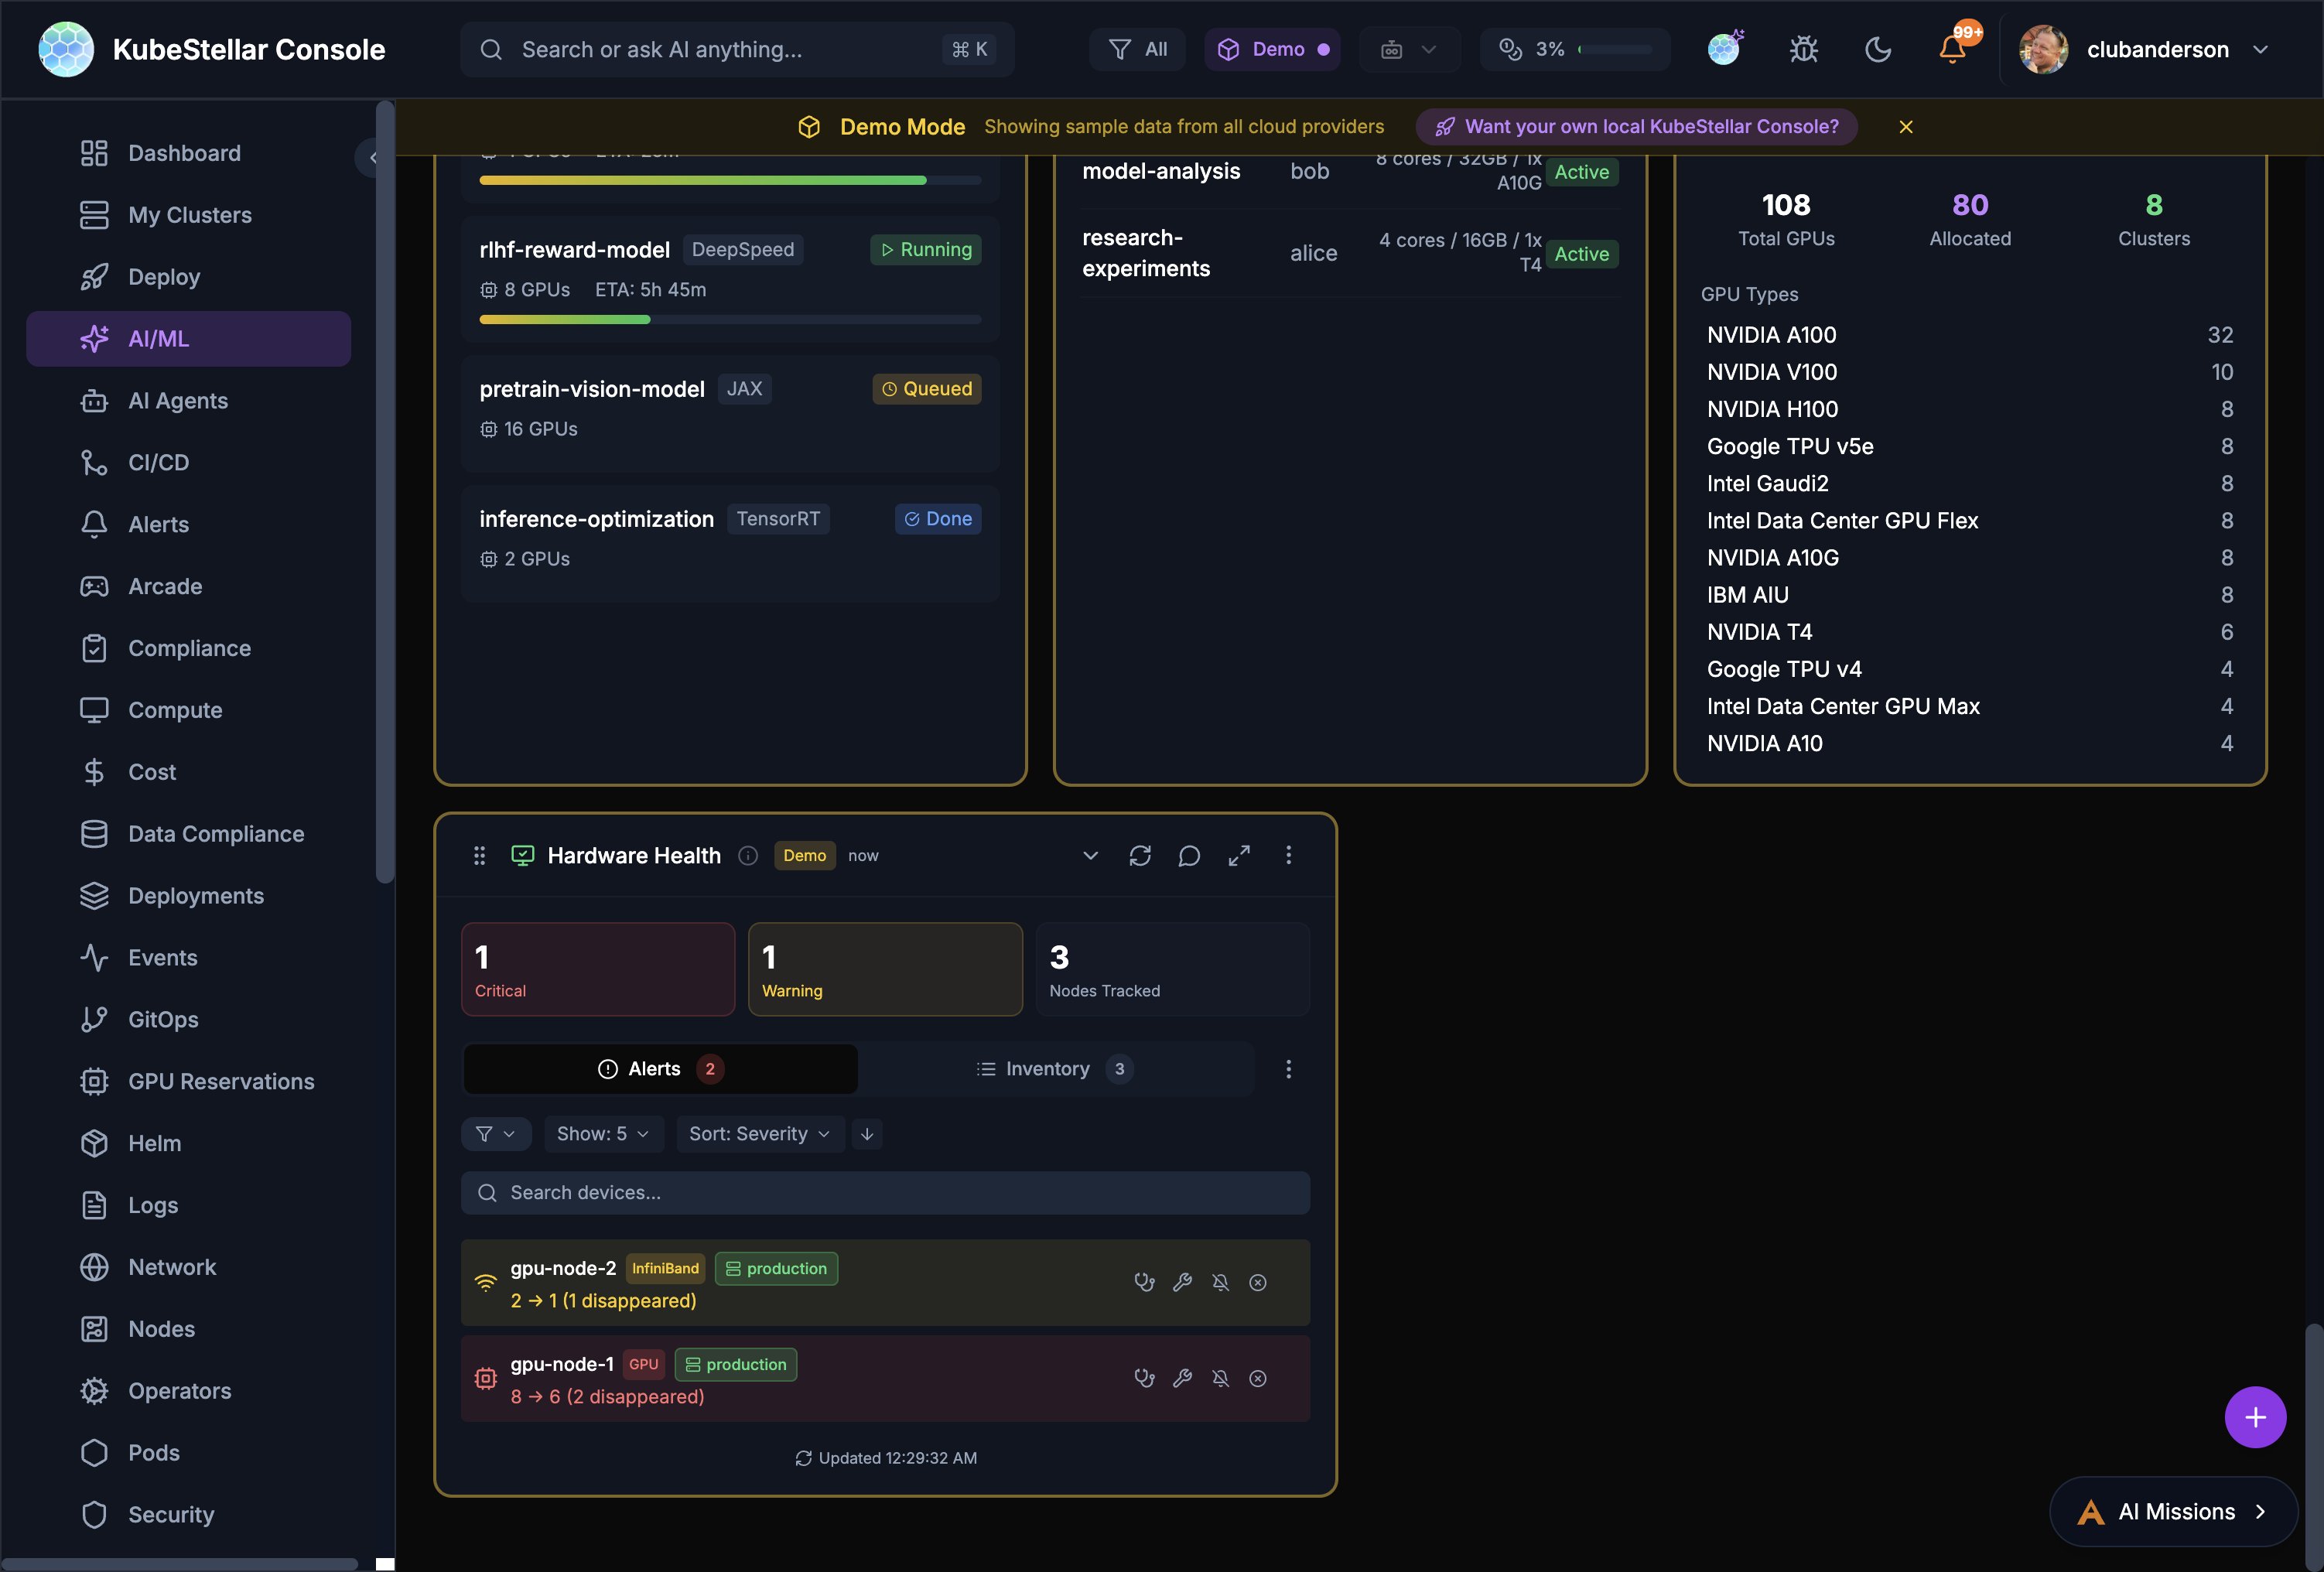
- Alert Summary: Critical and warning counts at a glance
- Device Inventory: Searchable list of all GPU/accelerator nodes
- Disappearance Tracking: Detects when devices go missing (e.g., “2 → 1 (1 disappeared)”)
- Per-Device Status: Shows environment labels (e.g., staging, production) and per-device alerts
Status Indicators
- All Healthy: Green status when no issues detected
- Issues Found: Red/orange status with counts of affected resources
- Predicted: Yellow bubble for AI-predicted future failures
- Drill-Down: Click counts to navigate to affected resources
Deploy Page
The Deploy page provides tools for managing deployments across clusters.
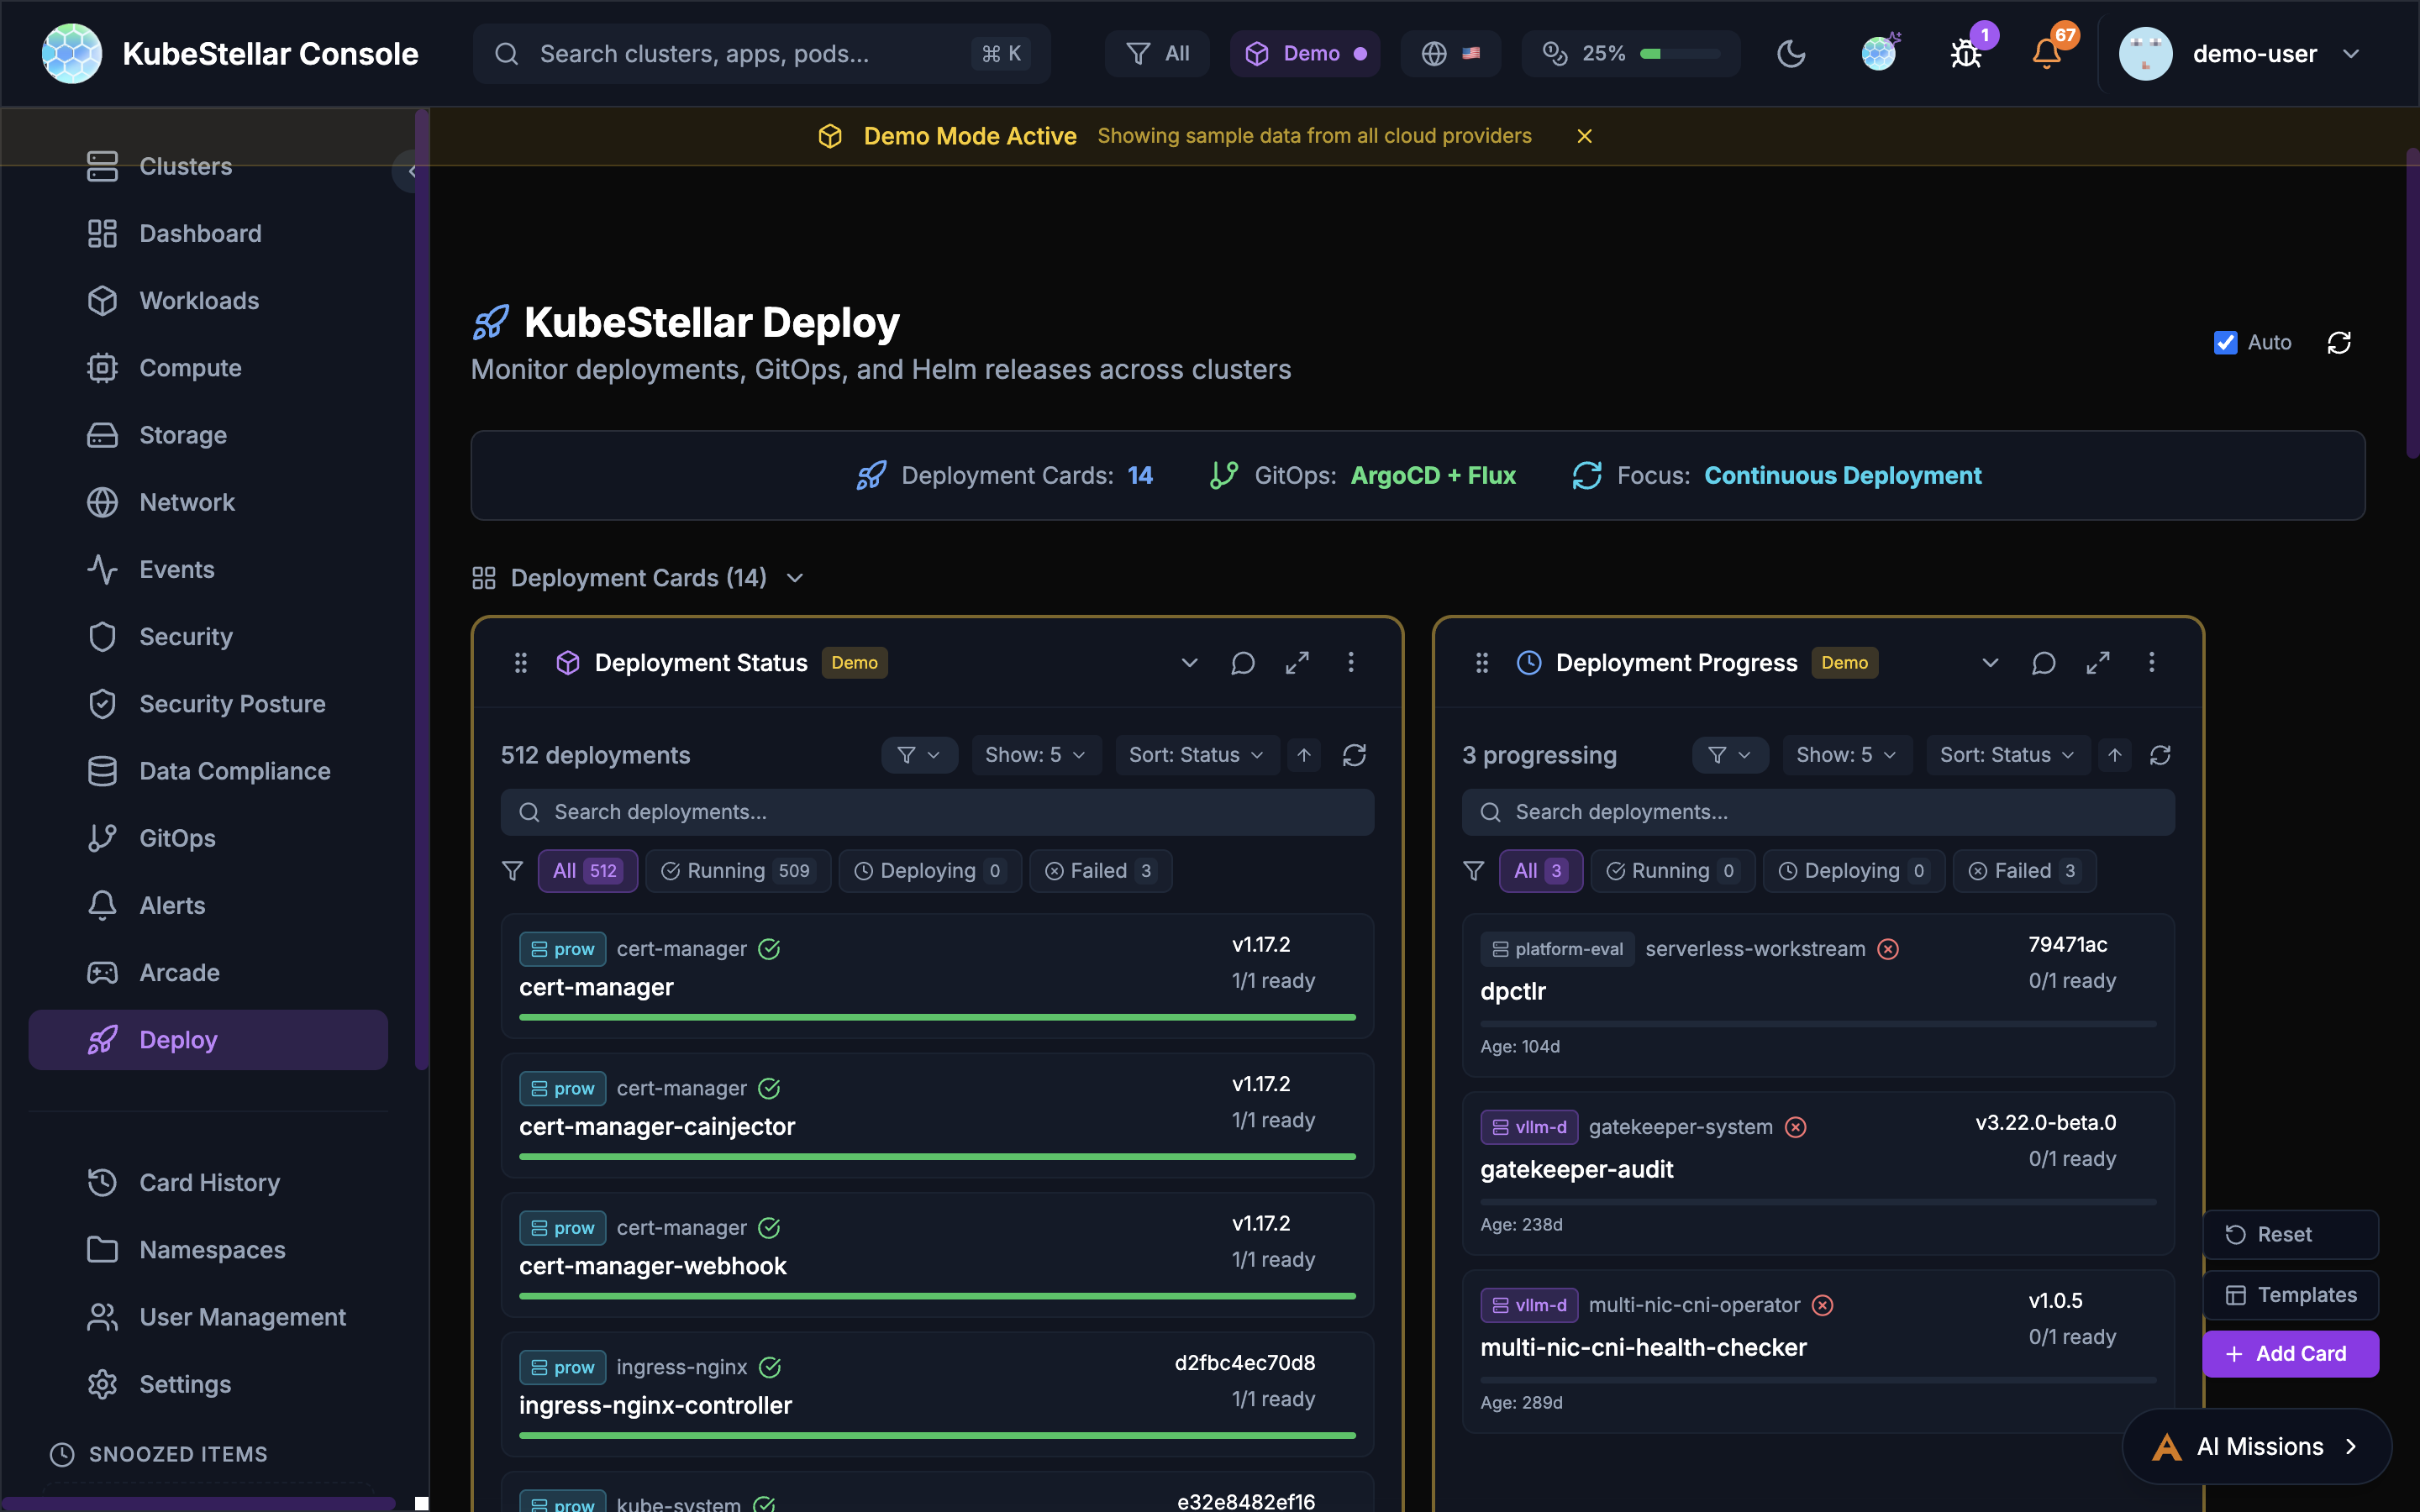
Deployment Cards
- Deployment Status: Overview of all deployments
- Deployment Progress: Track rollout progress
- Deployment Issues: View failing deployments
GitOps Integration
- GitOps Drift: Detect configuration drift from Git
- ArgoCD Applications: Manage ArgoCD apps across clusters
- ArgoCD Sync Status: Monitor sync state
- ArgoCD Health: Application health dashboard
Helm Management
- Helm Release Status: View deployed releases
- Helm History: Track release revisions
- Helm Chart Versions: Monitor chart updates
Kustomize
- Kustomization Status: Monitor Flux kustomizations
- Overlay Comparison: Compare environment overlays
Workload Deployment
Deploy workloads across clusters with drag-and-drop:
- Select a workload type (Deployment, StatefulSet, Job)
- Drag to target clusters on the world map
- Configure namespace and replicas
- Preview changes before applying
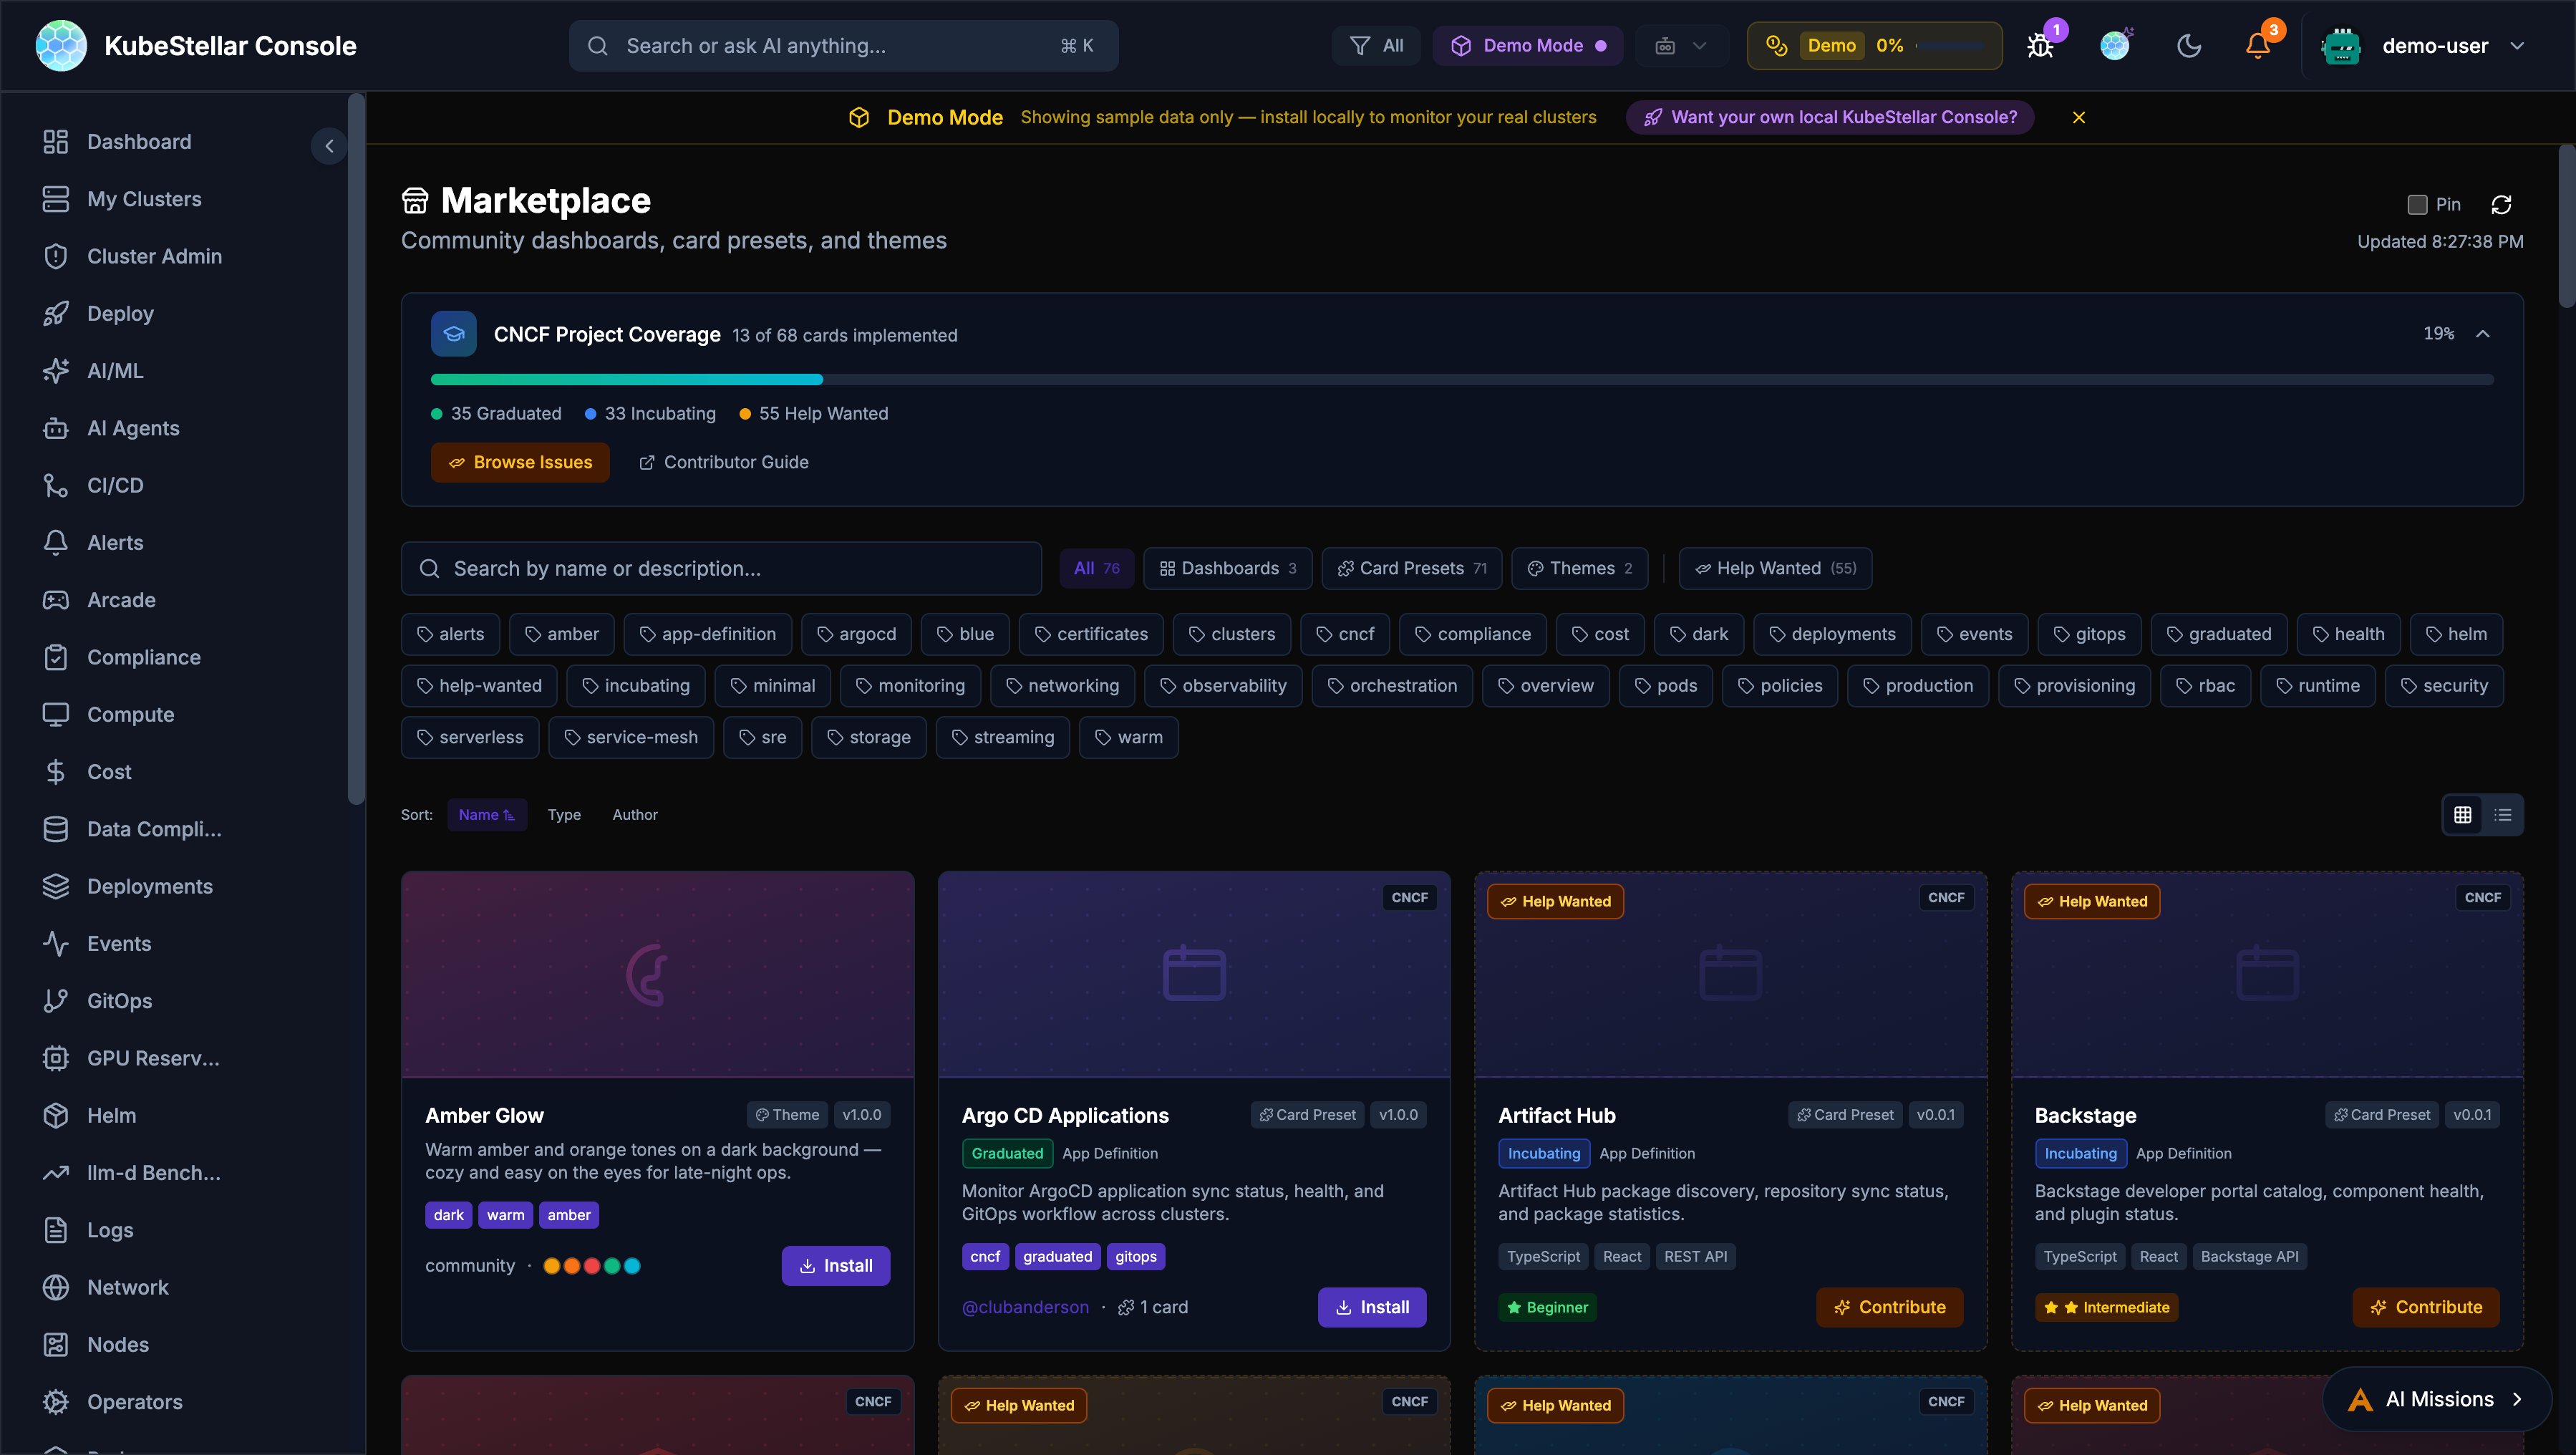
Marketplace
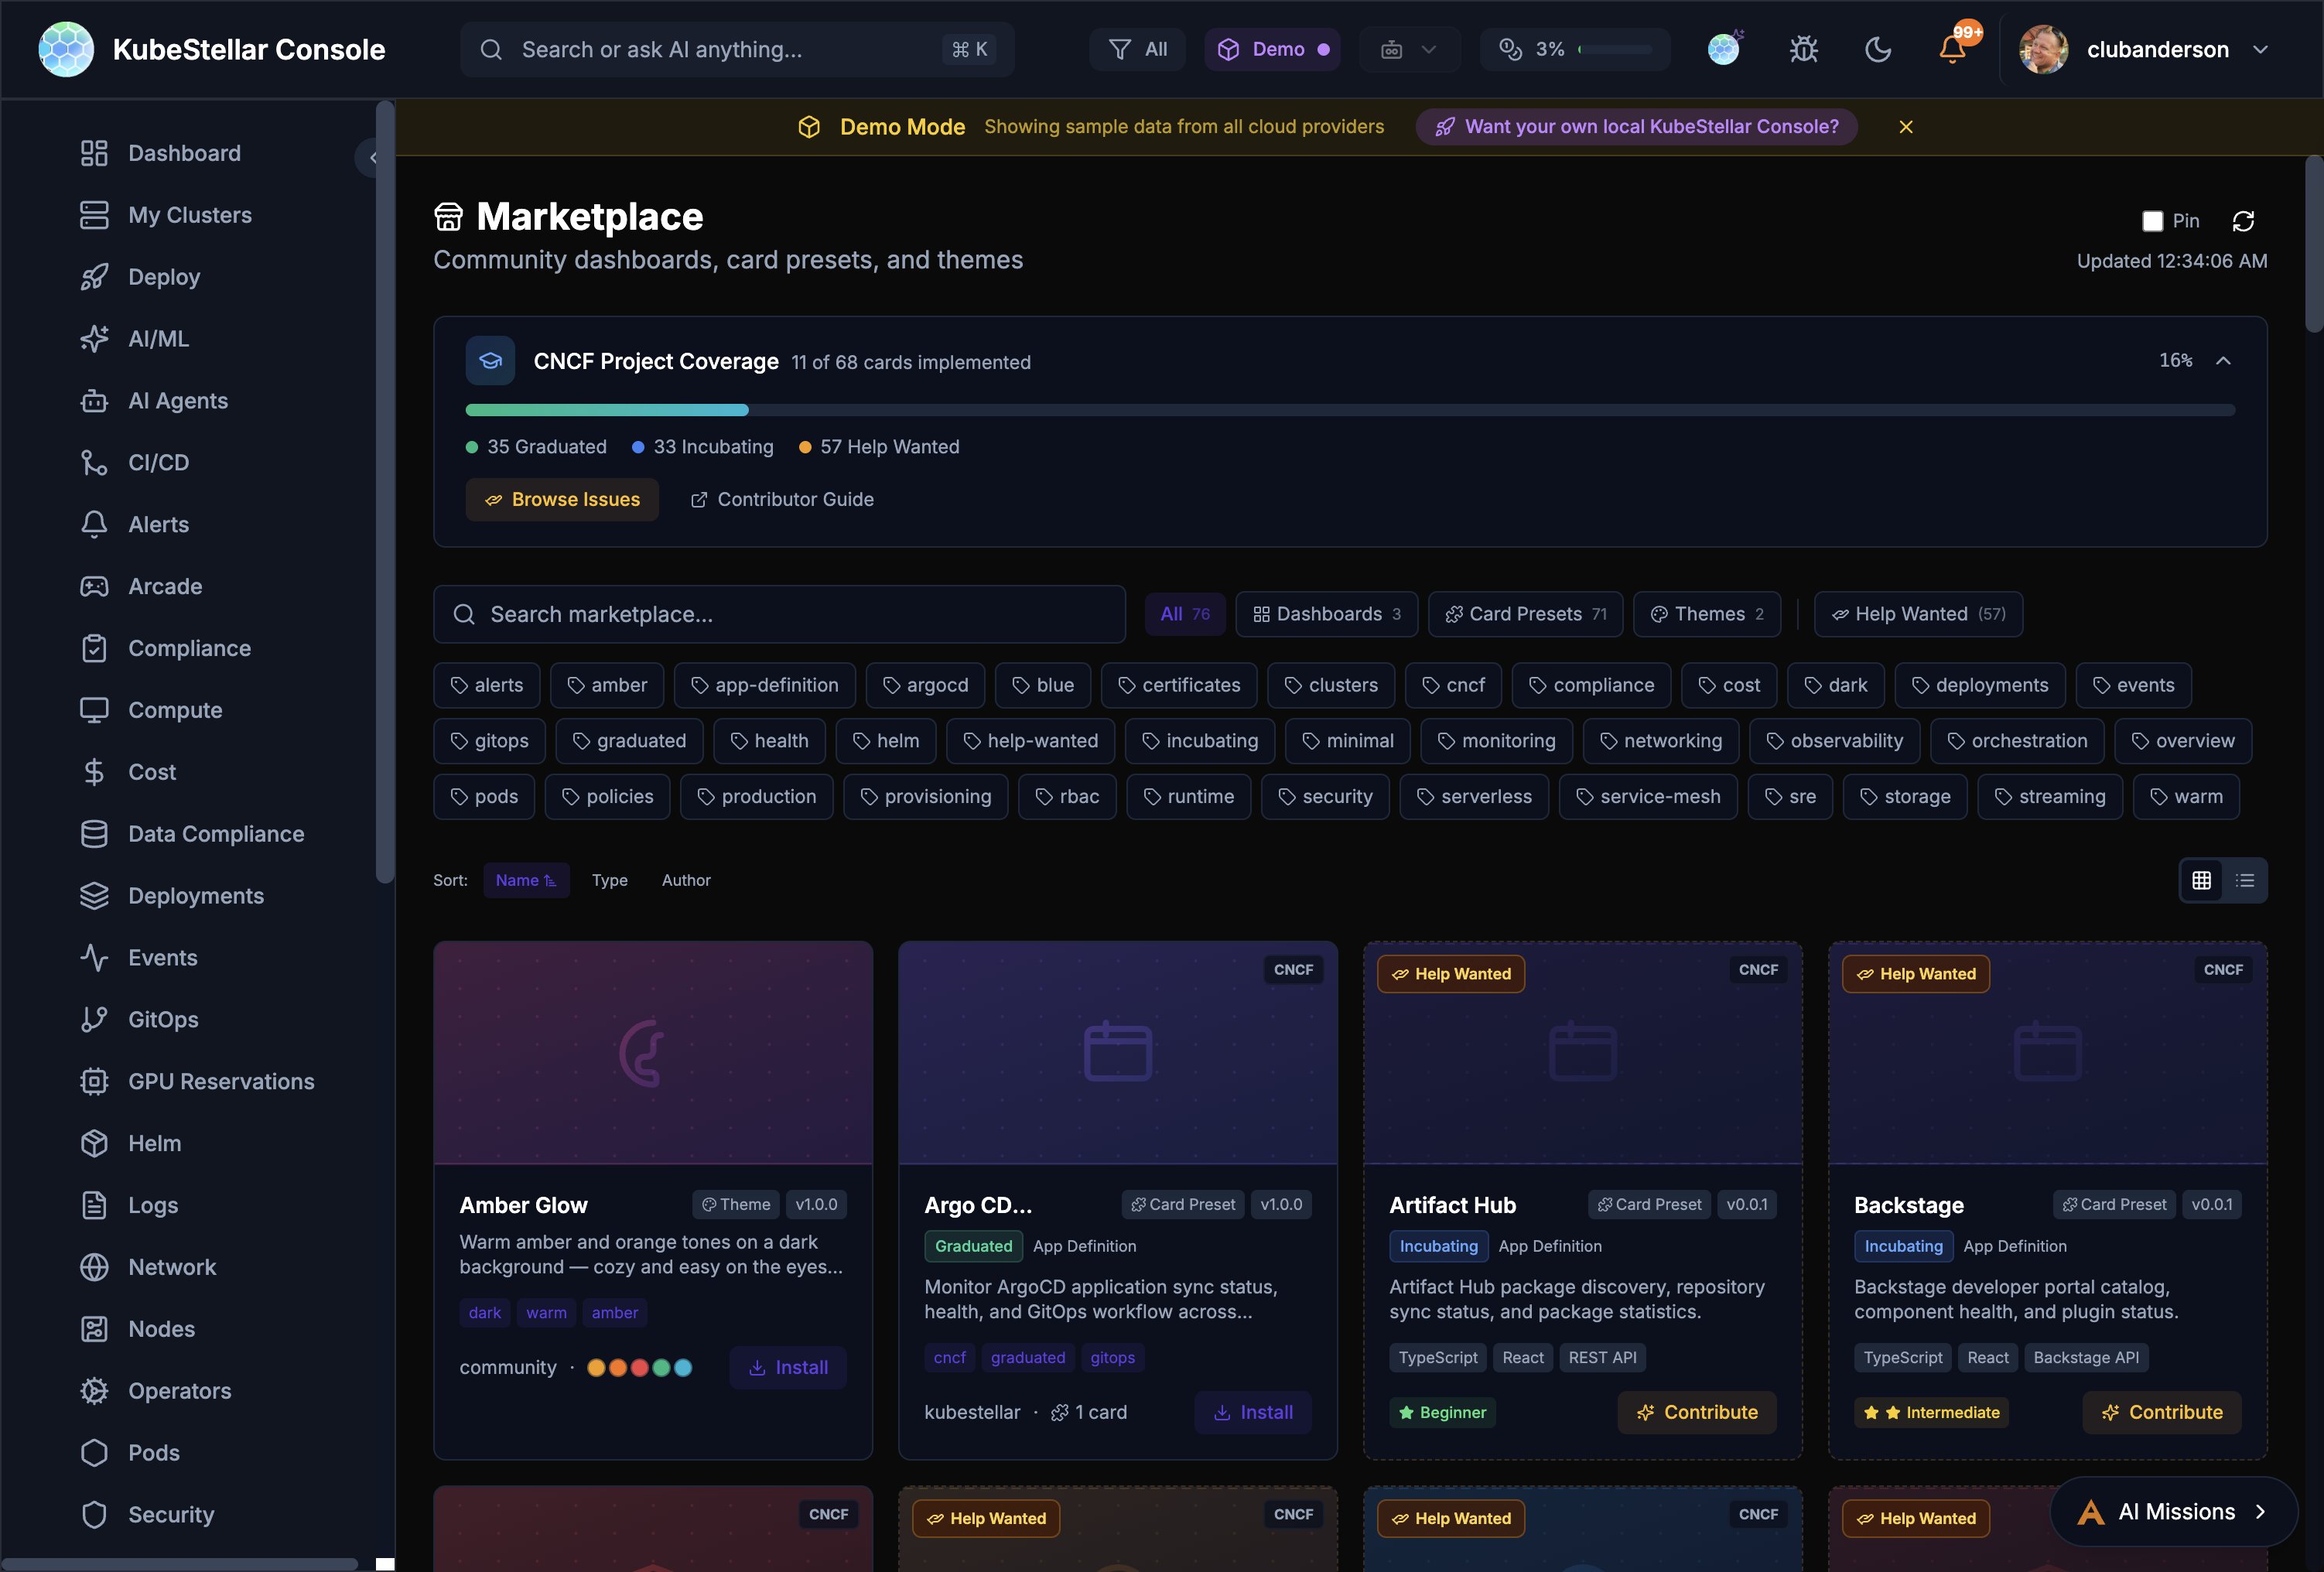
The Marketplace is a community hub for sharing dashboards, card presets, and themes.
What’s Available
- Dashboards - Pre-built dashboard layouts for specific use cases
- Card Presets - Curated sets of cards for common monitoring scenarios
- Themes - Visual themes for the console
- CNCF Projects - Cards and dashboards for 68 CNCF projects (graduated, incubating, sandbox)
CNCF Project Coverage
The Marketplace tracks coverage of CNCF projects:
- 35 Graduated projects with dashboard support
- 33 Incubating projects with monitoring cards
- 57 Help Wanted issues for community contributions
Installing from Marketplace
- Navigate to Marketplace in the sidebar
- Browse or search for what you need
- Filter by tags (graduated, helm, security, monitoring, etc.)
- Click Install to add to your console
- Installed dashboards appear in the sidebar with vanity URLs
Contributing
The Marketplace includes a Contributor Guide and links to Help Wanted issues for anyone who wants to create new dashboards or cards for the community.
Real-Time SSE Streaming
The console uses Server-Sent Events (SSE) for real-time data streaming, replacing polling-based REST calls for many resources.
Streamed Resources
The following resources are streamed in real-time via SSE:
- Pods, Deployments, Services - Core workload status
- Jobs, ConfigMaps, Secrets - Job lifecycle and configuration changes
- Operators and Subscriptions - OLM operator status and available upgrades
- Helm Releases - Release status across clusters
- Benchmark Data - Live benchmark results from Google Drive
- NVIDIA Operators - GPU operator status and health
How It Works
- The Go backend opens long-lived connections to each cluster
- Data is streamed to the frontend as JSON events
- The frontend updates cards instantly without full-page refresh
- Automatic reconnection on connection loss
- Fallback to REST polling if SSE is unavailable
Benefits
- Instant updates: No more waiting for refresh intervals
- Lower resource usage: Single connection per resource type instead of repeated polls
- Better UX: Cards update in real-time as cluster state changes
Performance Optimizations
Recent optimizations have dramatically improved console load times:
- 17x faster warm start: Card data loads near-instantly on subsequent visits
- 3.6x faster cold start: First-time page loads reduced from ~8s to ~2.2s
- Instant card rendering: Cards render immediately with cached data, then update in background
- Vite warmup: Dashboard pages are pre-warmed to eliminate navigation lag
- In-memory operator caching: Operator and subscription data is cached server-side with TTL, avoiding repeated kubectl calls
- Permanent error caching: Clusters without OLM are cached as permanent errors to skip future probes
- Demo data instant display: Cards configured with
demoWhenEmptyshow demo data immediately while real data loads - SSE response caching: Backend caches SSE responses for 15 seconds, reducing re-navigation latency from seconds to near-instant
- Per-cluster adaptive timeouts: Slow clusters are automatically tracked and given shorter timeouts (10s vs 60s) to prevent blocking
- Smart chunk prefetching: When
ENABLED_DASHBOARDSis configured, JavaScript chunks for enabled dashboards are prefetched, reducing initial network requests by ~80% - SSE deduplication: Frontend prevents duplicate concurrent SSE requests during rapid navigation
Local Cluster Creation
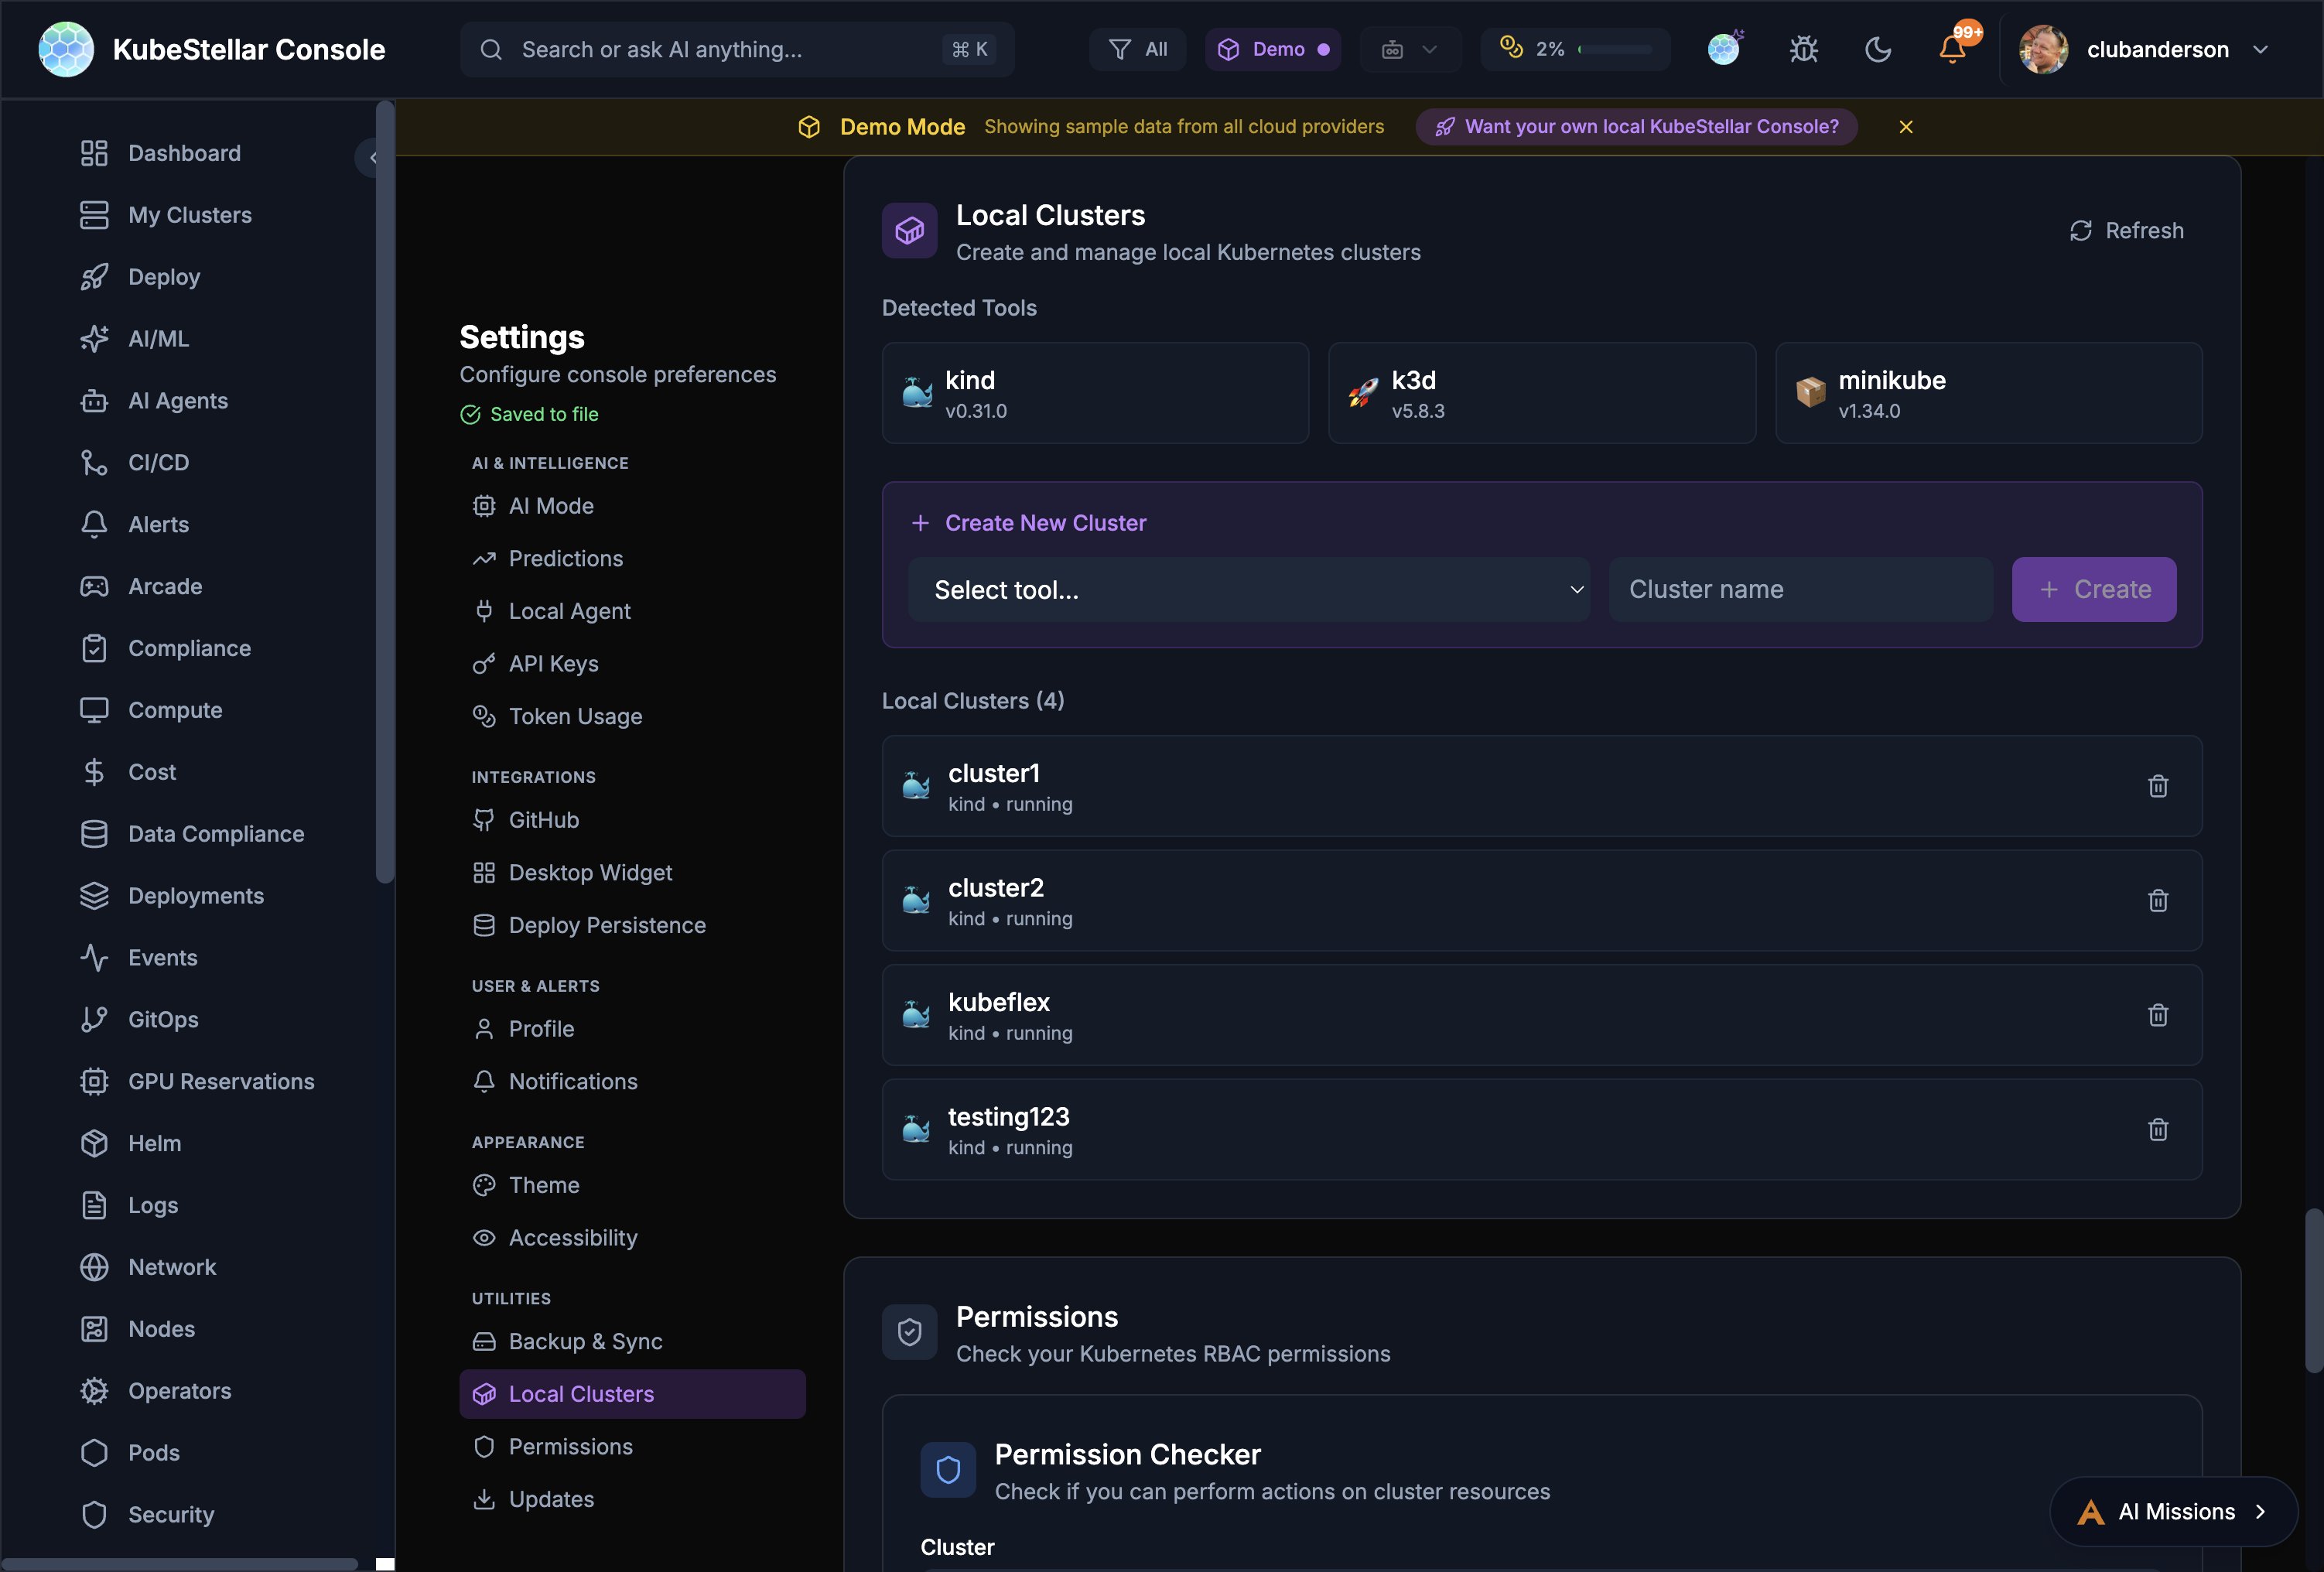
Create and manage local Kubernetes clusters directly from the console Settings page.
Supported Tools
The console auto-detects installed cluster creation tools:
- kind - Kubernetes in Docker
- k3d - Lightweight k3s in Docker
- minikube - Local Kubernetes with multiple drivers
Creating a Cluster
- Go to Settings > Utilities > Local Clusters
- Select a tool from the dropdown
- Enter a cluster name
- Click Create
- The cluster appears in your cluster list and is immediately available for monitoring
Managing Clusters
The Local Clusters page shows all local clusters with:
- Cluster name and creation tool
- Running status
- Delete button to remove clusters
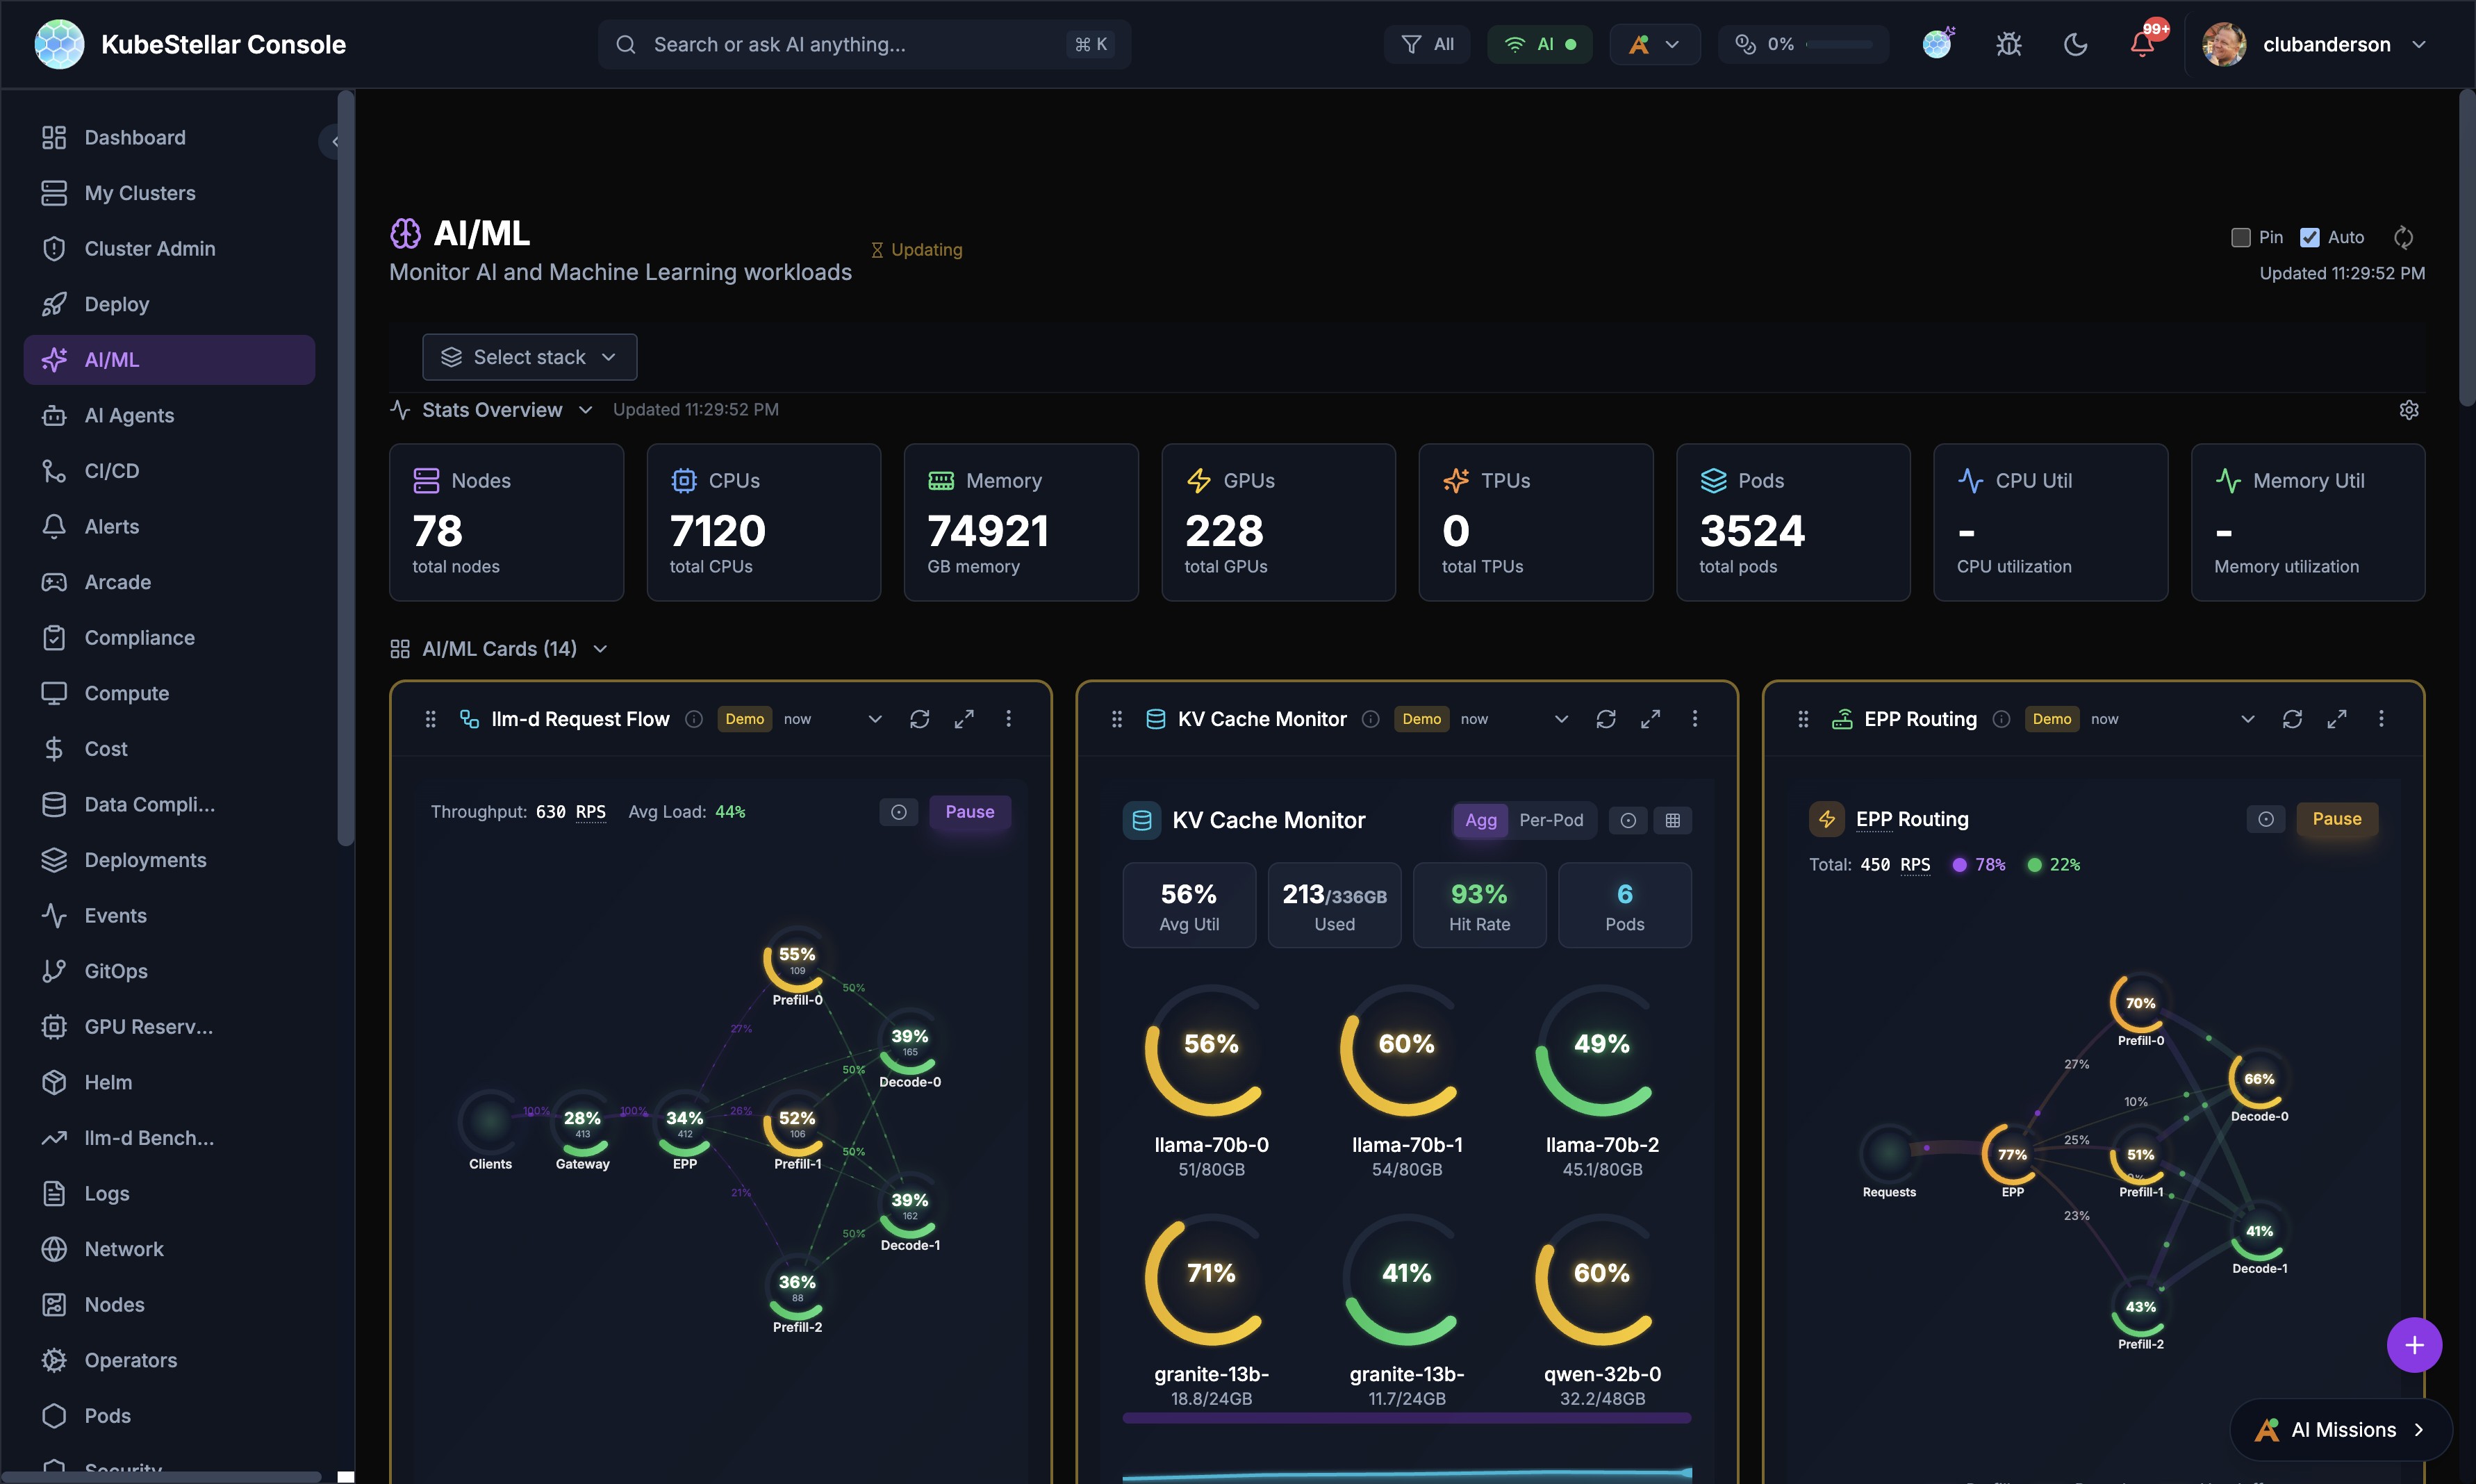
llm-d Inference Monitoring
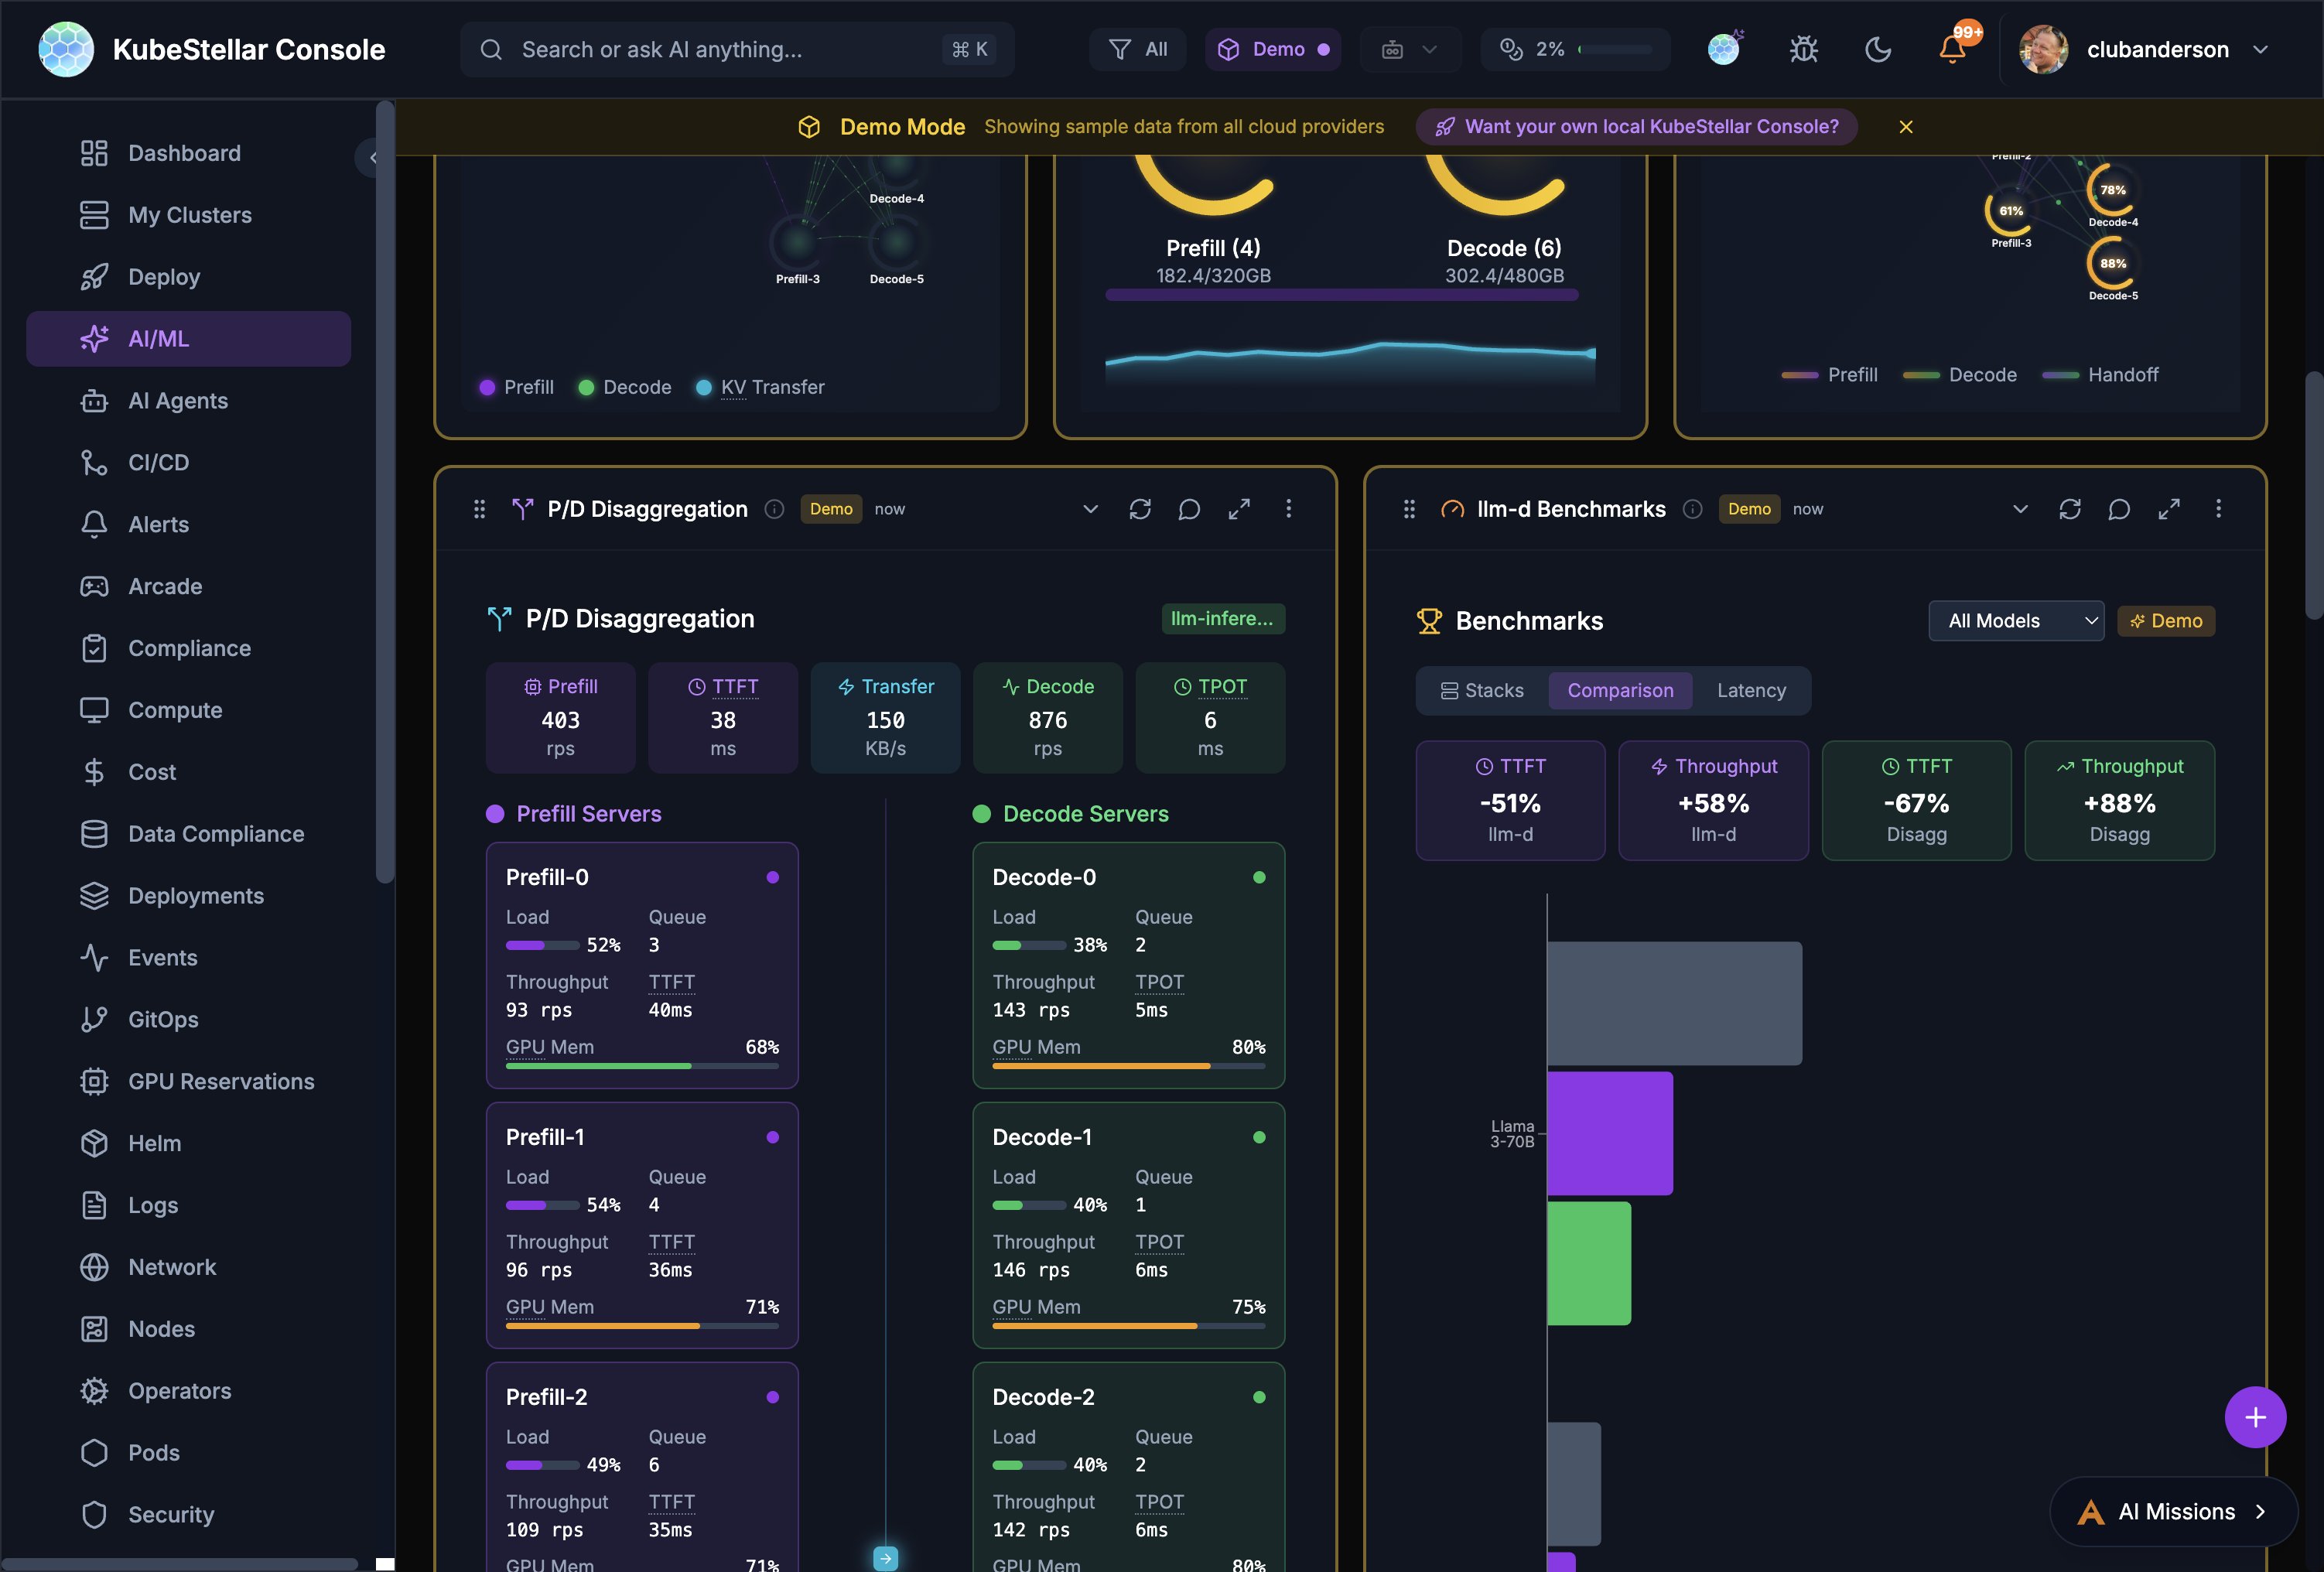
The AI/ML dashboard includes specialized cards for monitoring llm-d inference serving stacks.
Stack Discovery
The console automatically discovers llm-d stacks across your clusters:
- Scans all namespaces for llm-d deployments
- Detects vLLM, TGI, llm-d, and Triton inference servers
- Shows stack health with component status
Key Cards
- Request Flow - Animated visualization of requests flowing through the inference pipeline
- KV Cache Monitor - Real-time KV cache utilization with per-pod breakdowns
- EPP Routing - Endpoint Picker routing decisions, RPS, and distribution
- P/D Disaggregation - Separate prefill and decode server metrics including load, queue depth, throughput, TPOT, and GPU memory
- Benchmarks - Compare stacks with TTFT, throughput, and latency charts
- Configurator - Configure inference strategies (Intelligent Scheduling, P/D Disaggregation, Wide Expert Parallelism, Variant Autoscaling)
Real Prometheus Metrics
The four LLM-d visualization cards (Request Flow, KV Cache Monitor, EPP Routing, P/D Disaggregation) display real per-pod Prometheus metrics from vLLM when available:
- A Prometheus query proxy routes queries through the Kubernetes API server’s service proxy — no port-forwarding or extra configuration needed
- Six vLLM metrics are polled every 5 seconds: request throughput, KV cache utilization, time-to-first-token, inter-token latency, batch size, and queue depth
- Cards gracefully fall back to simulated data when Prometheus is unavailable
- Per-pod views show individual vLLM instance metrics with color-coded health indicators
llm-d AI Insights
The AI Insights card provides automated analysis of your inference stack configuration, identifying:
- Balanced vs imbalanced prefill-to-decode ratios
- Optimization opportunities
- Configuration recommendations
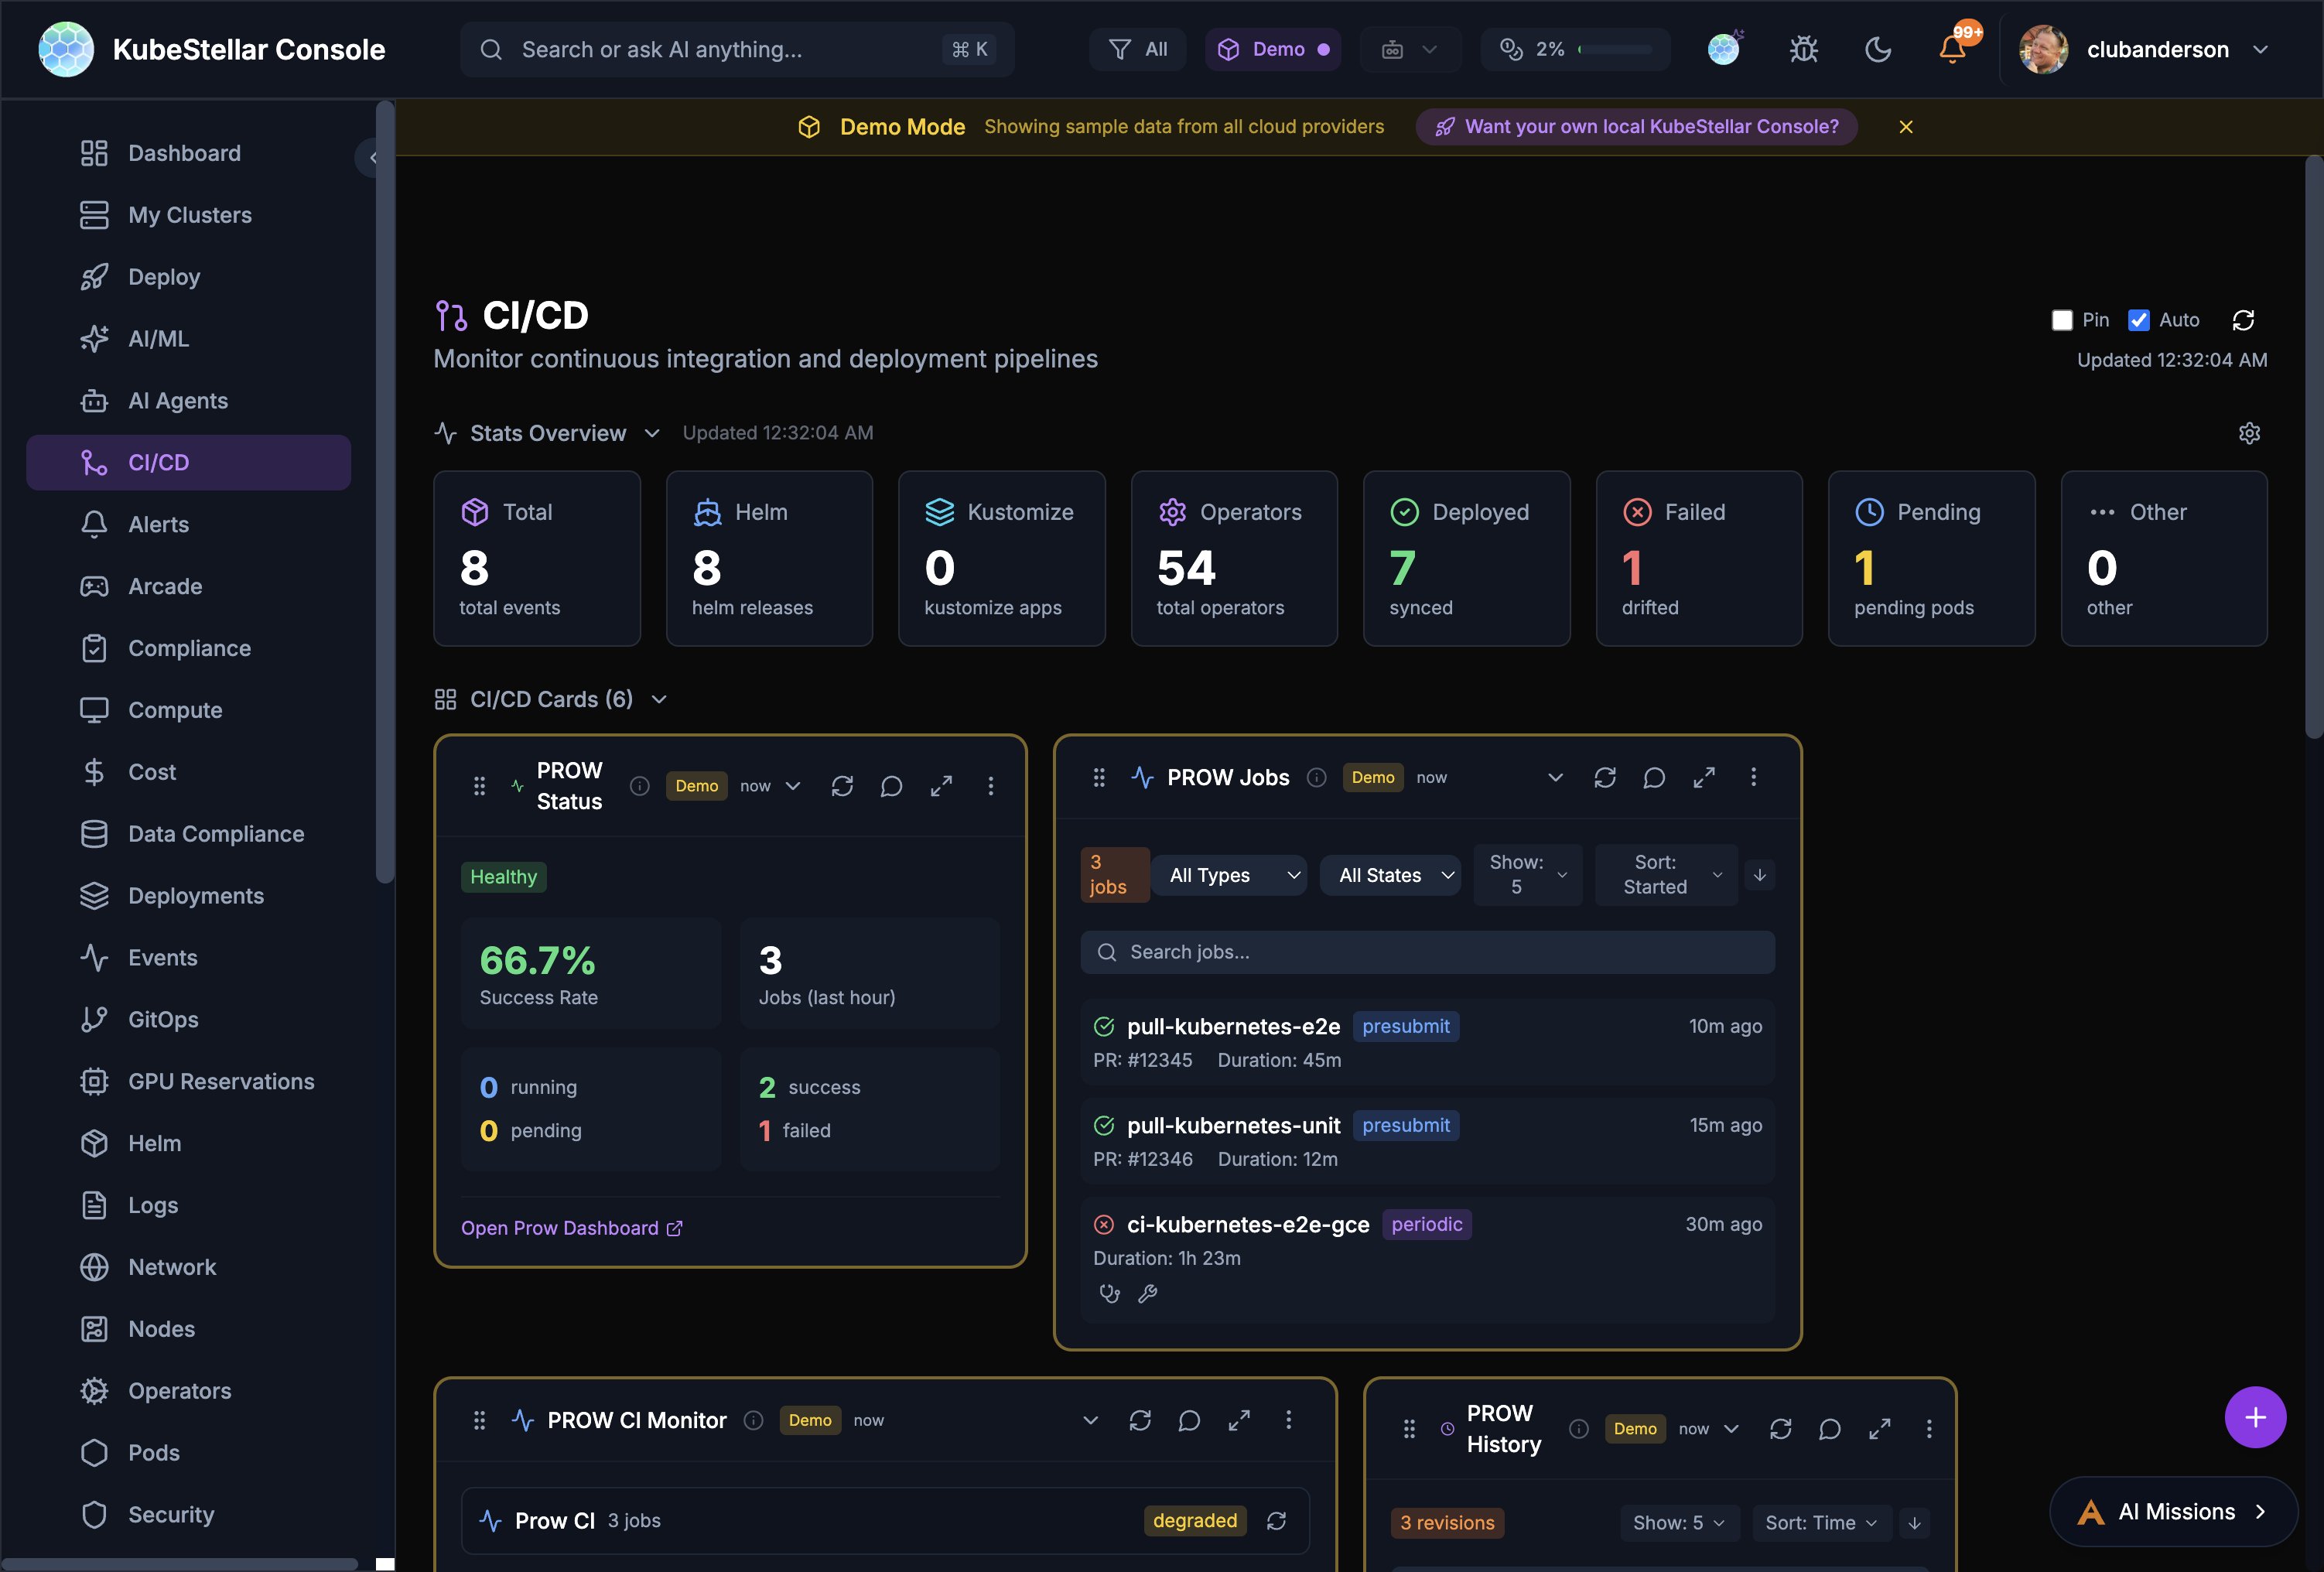
PROW CI Monitoring
The CI/CD dashboard includes PROW CI integration for monitoring Kubernetes-style CI/CD.
PROW Status Card
Shows overall PROW health:
- Success rate percentage
- Job counts in the last hour
- Running, pending, and failed job breakdown
- Link to your PROW dashboard
PROW Jobs Card
Filterable list of PROW jobs:
- Filter by job type (presubmit, postsubmit, periodic, batch)
- Filter by state (all states, triggered, pending, running, succeeded, failed)
- Each job shows PR number, duration, and age
- Click to open the job in your PROW instance
PROW History Card
Revision history showing pass/fail trends over time.
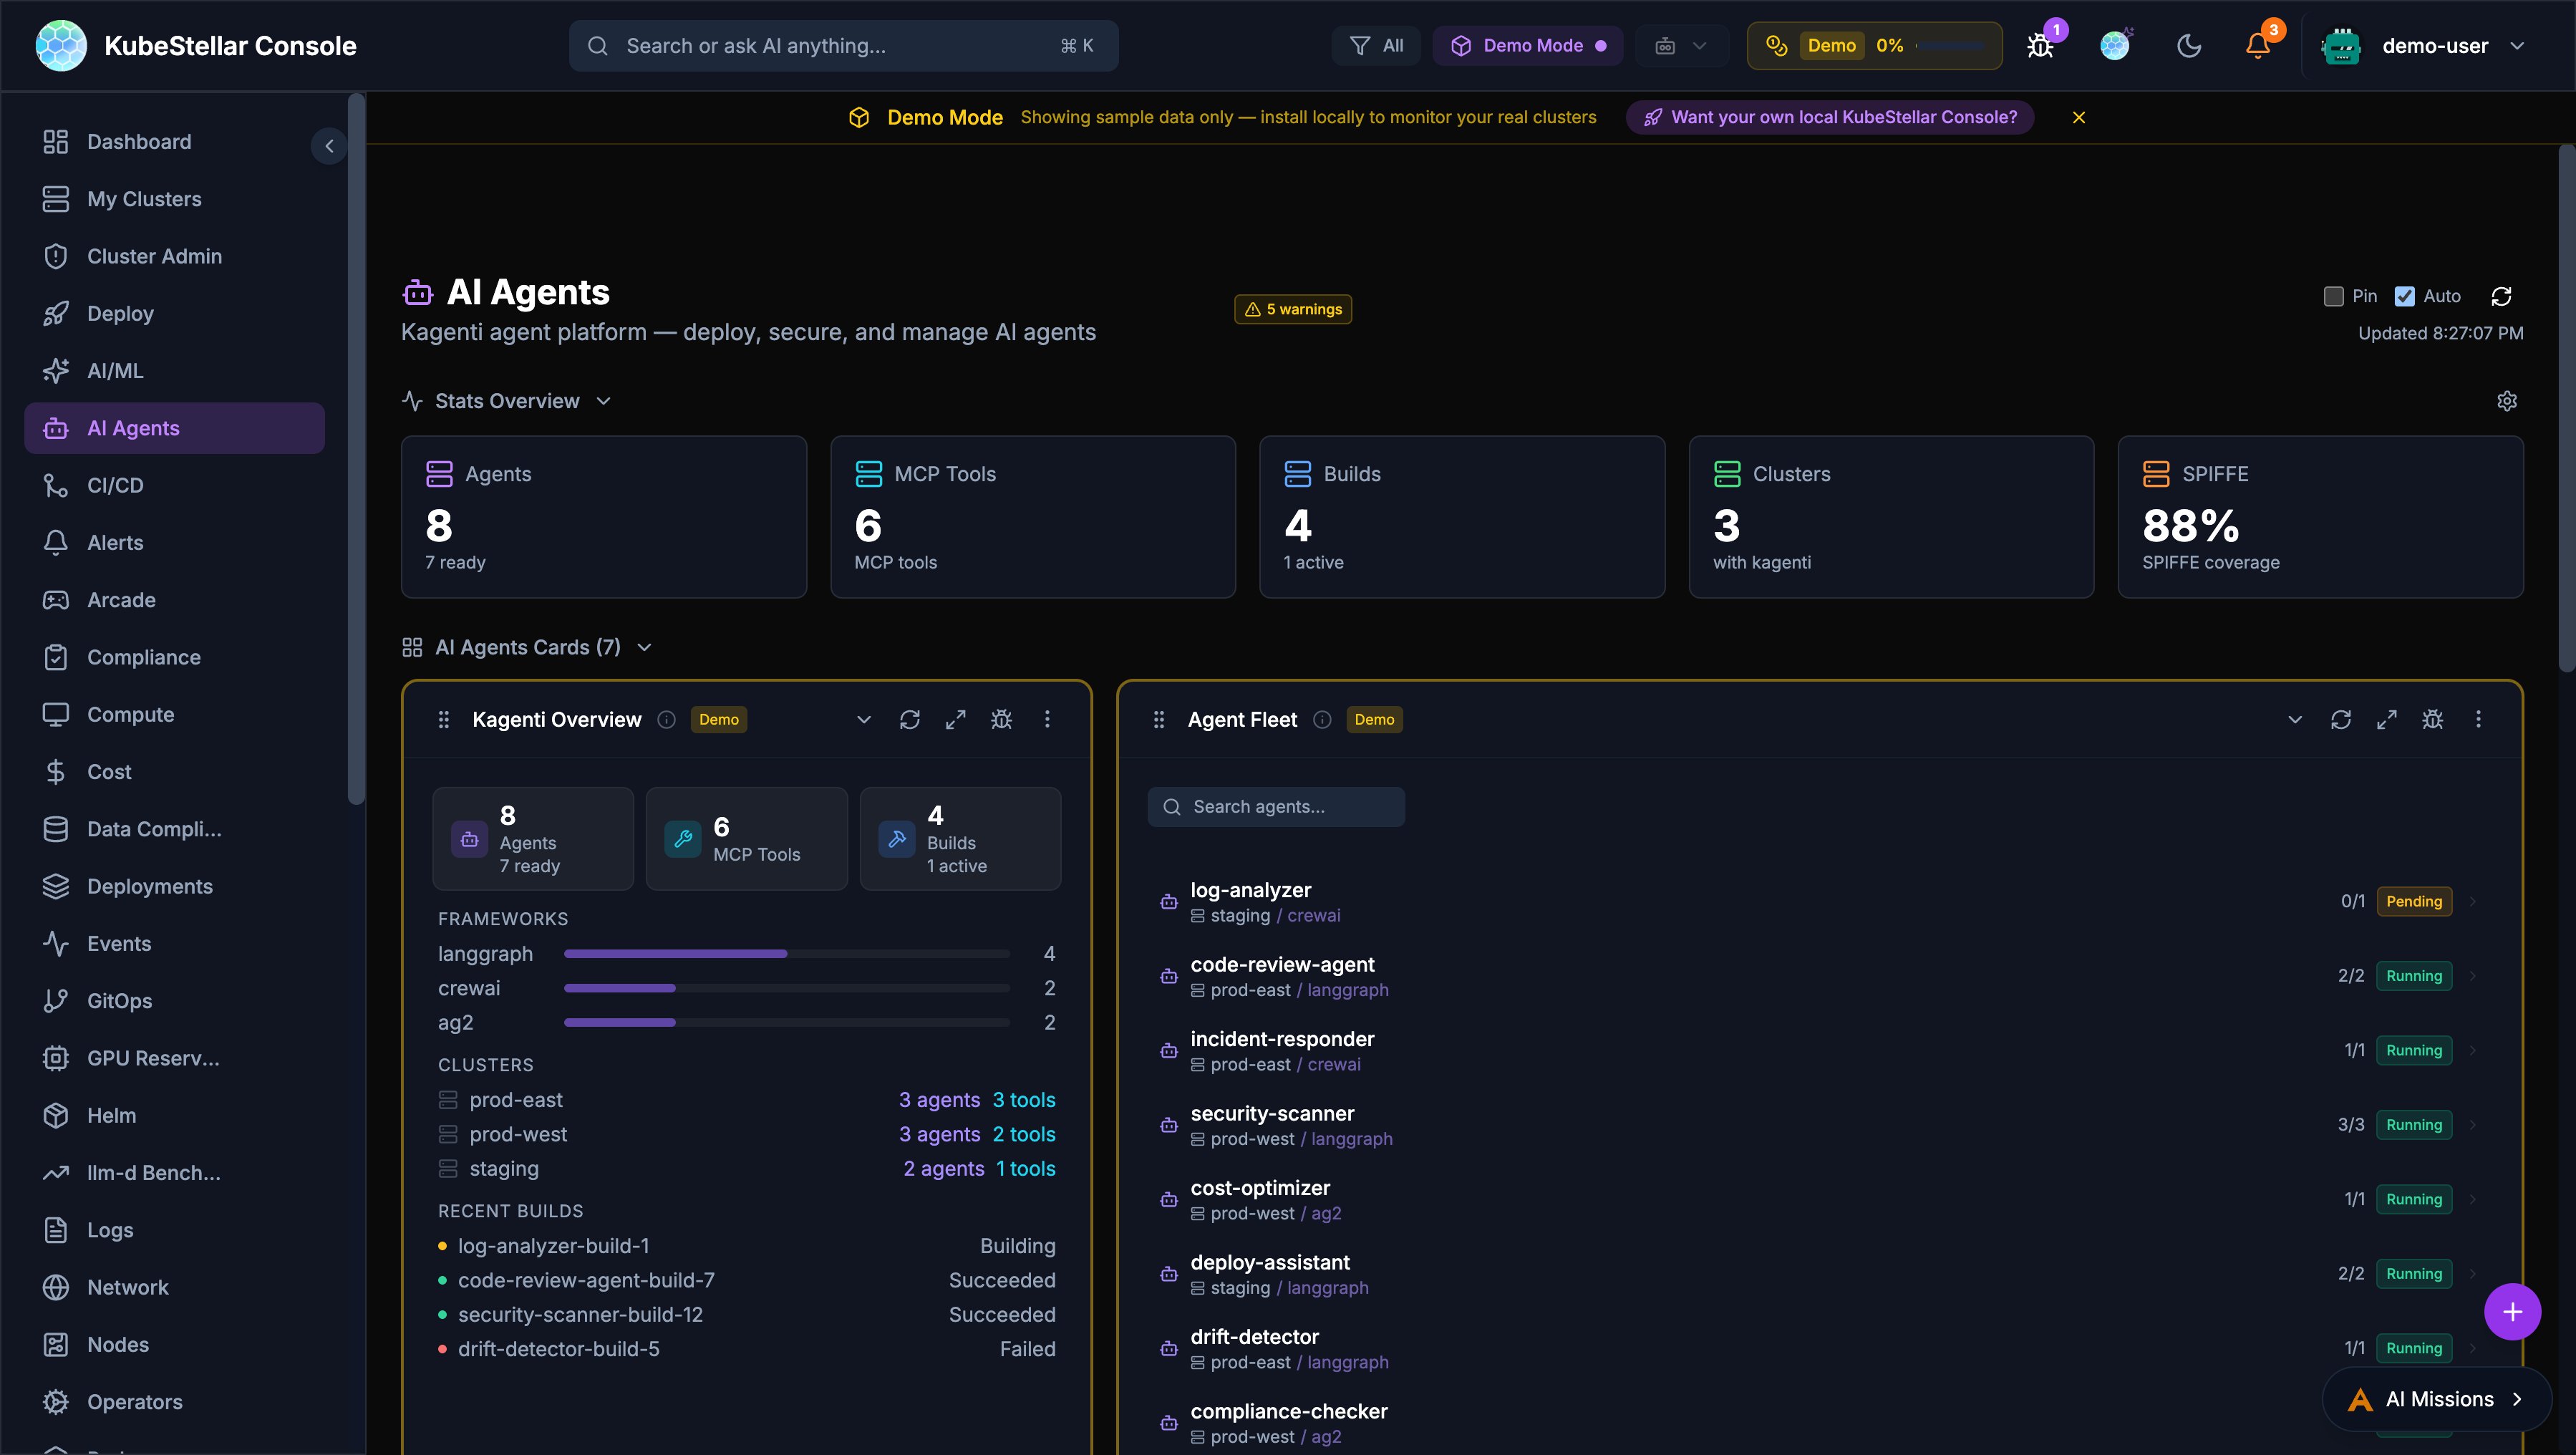
Kagenti AI Agents
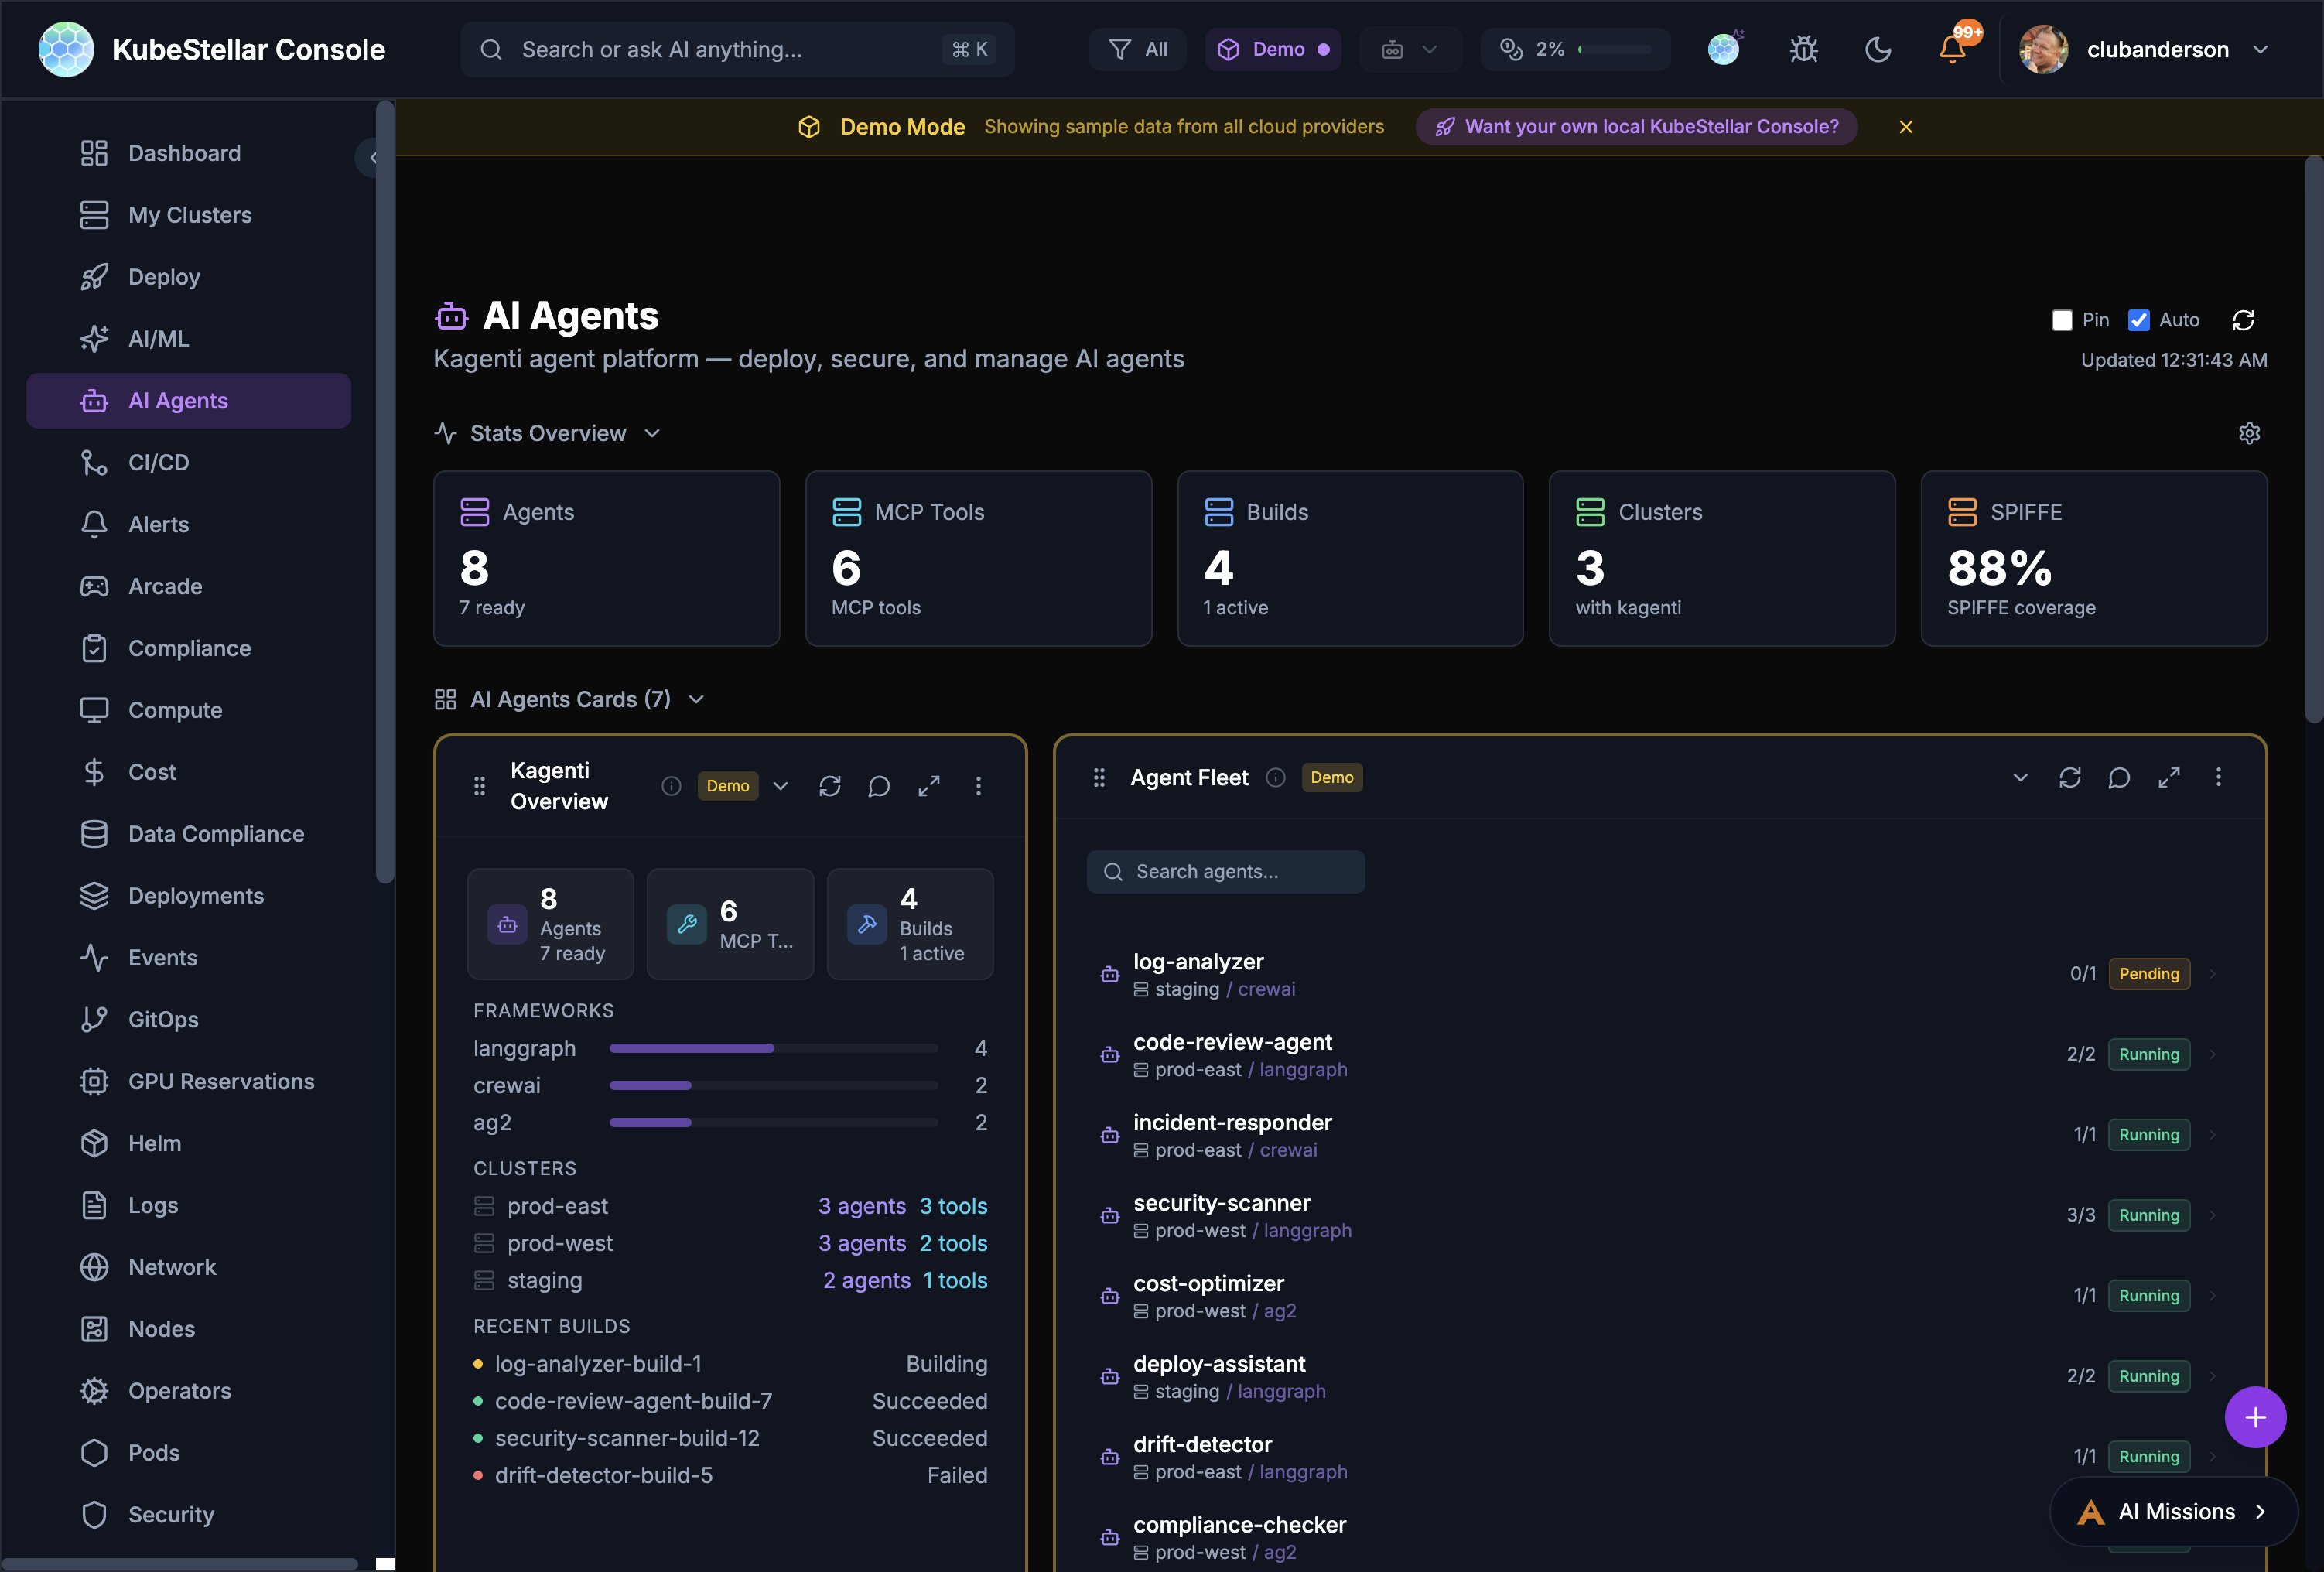
The AI Agents dashboard provides a management plane for Kagenti AI agents deployed across clusters.
Overview
- Agent Count: Total agents and their readiness state
- MCP Tools: Number of Model Context Protocol tools available
- Builds: Active and recent build status
- Clusters: Clusters with Kagenti installed
- SPIFFE Coverage: Identity and security coverage percentage
Agent Fleet
Searchable list of all deployed agents showing:
- Agent name and cluster placement
- Framework (LangGraph, CrewAI, AG2)
- Replica count and status (Running, Pending)
- Per-agent actions (diagnose, repair, logs)
Diagnose & Repair
Every card in the console has AI-powered Diagnose and Repair buttons:
- Diagnose - Opens an AI mission to analyze the card’s data
- Repair - Opens an AI mission to fix detected issues
- Available as compact icon buttons on every card’s toolbar
Nightly E2E Test Monitoring
The CI/CD dashboard includes a Nightly E2E Tests card that monitors end-to-end test results across llm-d infrastructure guides.
GPU Failure Detection
The card distinguishes between actual test failures and GPU unavailability:
- Red dots indicate genuine test failures
- Amber dots indicate GPU unavailability failures (e.g., insufficient GPU quota)
- Green dots indicate successful runs
- Flashing blue dots indicate currently running or queued jobs
The backend classifies failures by inspecting GitHub Actions job steps to determine whether a failure was caused by missing GPU resources or an actual test regression.
Per-Run Metadata
Hovering over individual run dots in the detail panel reveals infrastructure information:
- Model: Which LLM model was tested (e.g.,
granite-3.3-2b-instruct) - GPU type: GPU accelerator used (e.g.,
NVIDIA L40S) - GPU count: Number of GPUs allocated
- Duration: How long the run took
- Run number: GitHub Actions run identifier
Log and Artifact Links
Hovering over failed (red) or GPU-unavailable (amber) run dots shows a popup with:
- Clickable View Logs link to the GitHub Actions run
- Clickable Artifacts link to retained pod logs (available for 7 days)
- Failure type classification (test failure vs GPU unavailability)
CoreWeave Cluster Support
CoreWeave is recognized as a cloud provider with automatic detection:
- Clusters are identified via
.coreweave.comURL patterns orcoreweavein the cluster name - CoreWeave clusters display a branded icon with the double-wave mark
- Cluster detail modals include a direct link to the CoreWeave console
- CoreWeave-specific color scheme is applied to cluster cards
Data Freshness Indicators
Eight core cards now display real-time data freshness information:
- “Updated Xs ago” timestamp shows when data was last refreshed
- A spinning icon appears during background data refresh
- An amber warning icon appears when data is stale (older than 5 minutes)
Affected cards: EventStream, EventsTimeline, TopPods, NamespaceOverview, ProwJobs, LLMInference, LLMModels, and ResourceCapacity.
Auto-Scaling Number Formatting
Stat blocks in the Stats Overview bar automatically format large numbers to prevent overflow:
- Values 10,000+ display as compact format (e.g.,
7.1Kinstead of7120) - Values 1,000,000+ display as millions (e.g.,
1.2M) - Values under 10,000 display as full numbers
- Memory values auto-scale through MB, GB, TB, and PB ranges
Improved Modal Safety
Form modals throughout the console have been hardened against accidental data loss:
- Backdrop click protection: Form modals (StatsConfig, APIKeySettings, WidgetExport, NamespaceQuotas, CardChat) no longer close when clicking outside, preventing accidental data loss
- Escape key handling: Custom dropdowns (AlertBadge, ClusterSelect, FloatingDashboardActions) properly close with the Escape key
- Error notifications: Five critical operations (sign-in, OPA policy toggle, policy deletion, role updates, user deletion) now show toast notifications on failure instead of silent console errors
Semantic Color System
Error and status colors have been standardized across the entire console:
| Color | Meaning |
|---|---|
| Red | Errors, failures, critical issues |
| Yellow | Warnings, pending states |
| Orange | Warning-level alerts, medium severity |
| Green | Healthy, success, running |
| Blue | Active, in-progress, informational |
| Violet/Purple | AI/ML features and insights |
Crossplane Managed Resources Card
A new community-contributed card displays Crossplane managed resources:
- Shows managed resource count, provider health, and composite resource status
- Displays resource table with name, kind, provider, synced/ready status, and age
- Integrates with the Crossplane operator running in connected clusters
Cloud Native Buildpacks Card
A new community-contributed card monitors Cloud Native Buildpacks:
- Displays build counts, success rates, and active builders
- Shows recent builds with status, duration, and builder information
- Tracks buildpack versions and update availability
Add Cluster Dialog
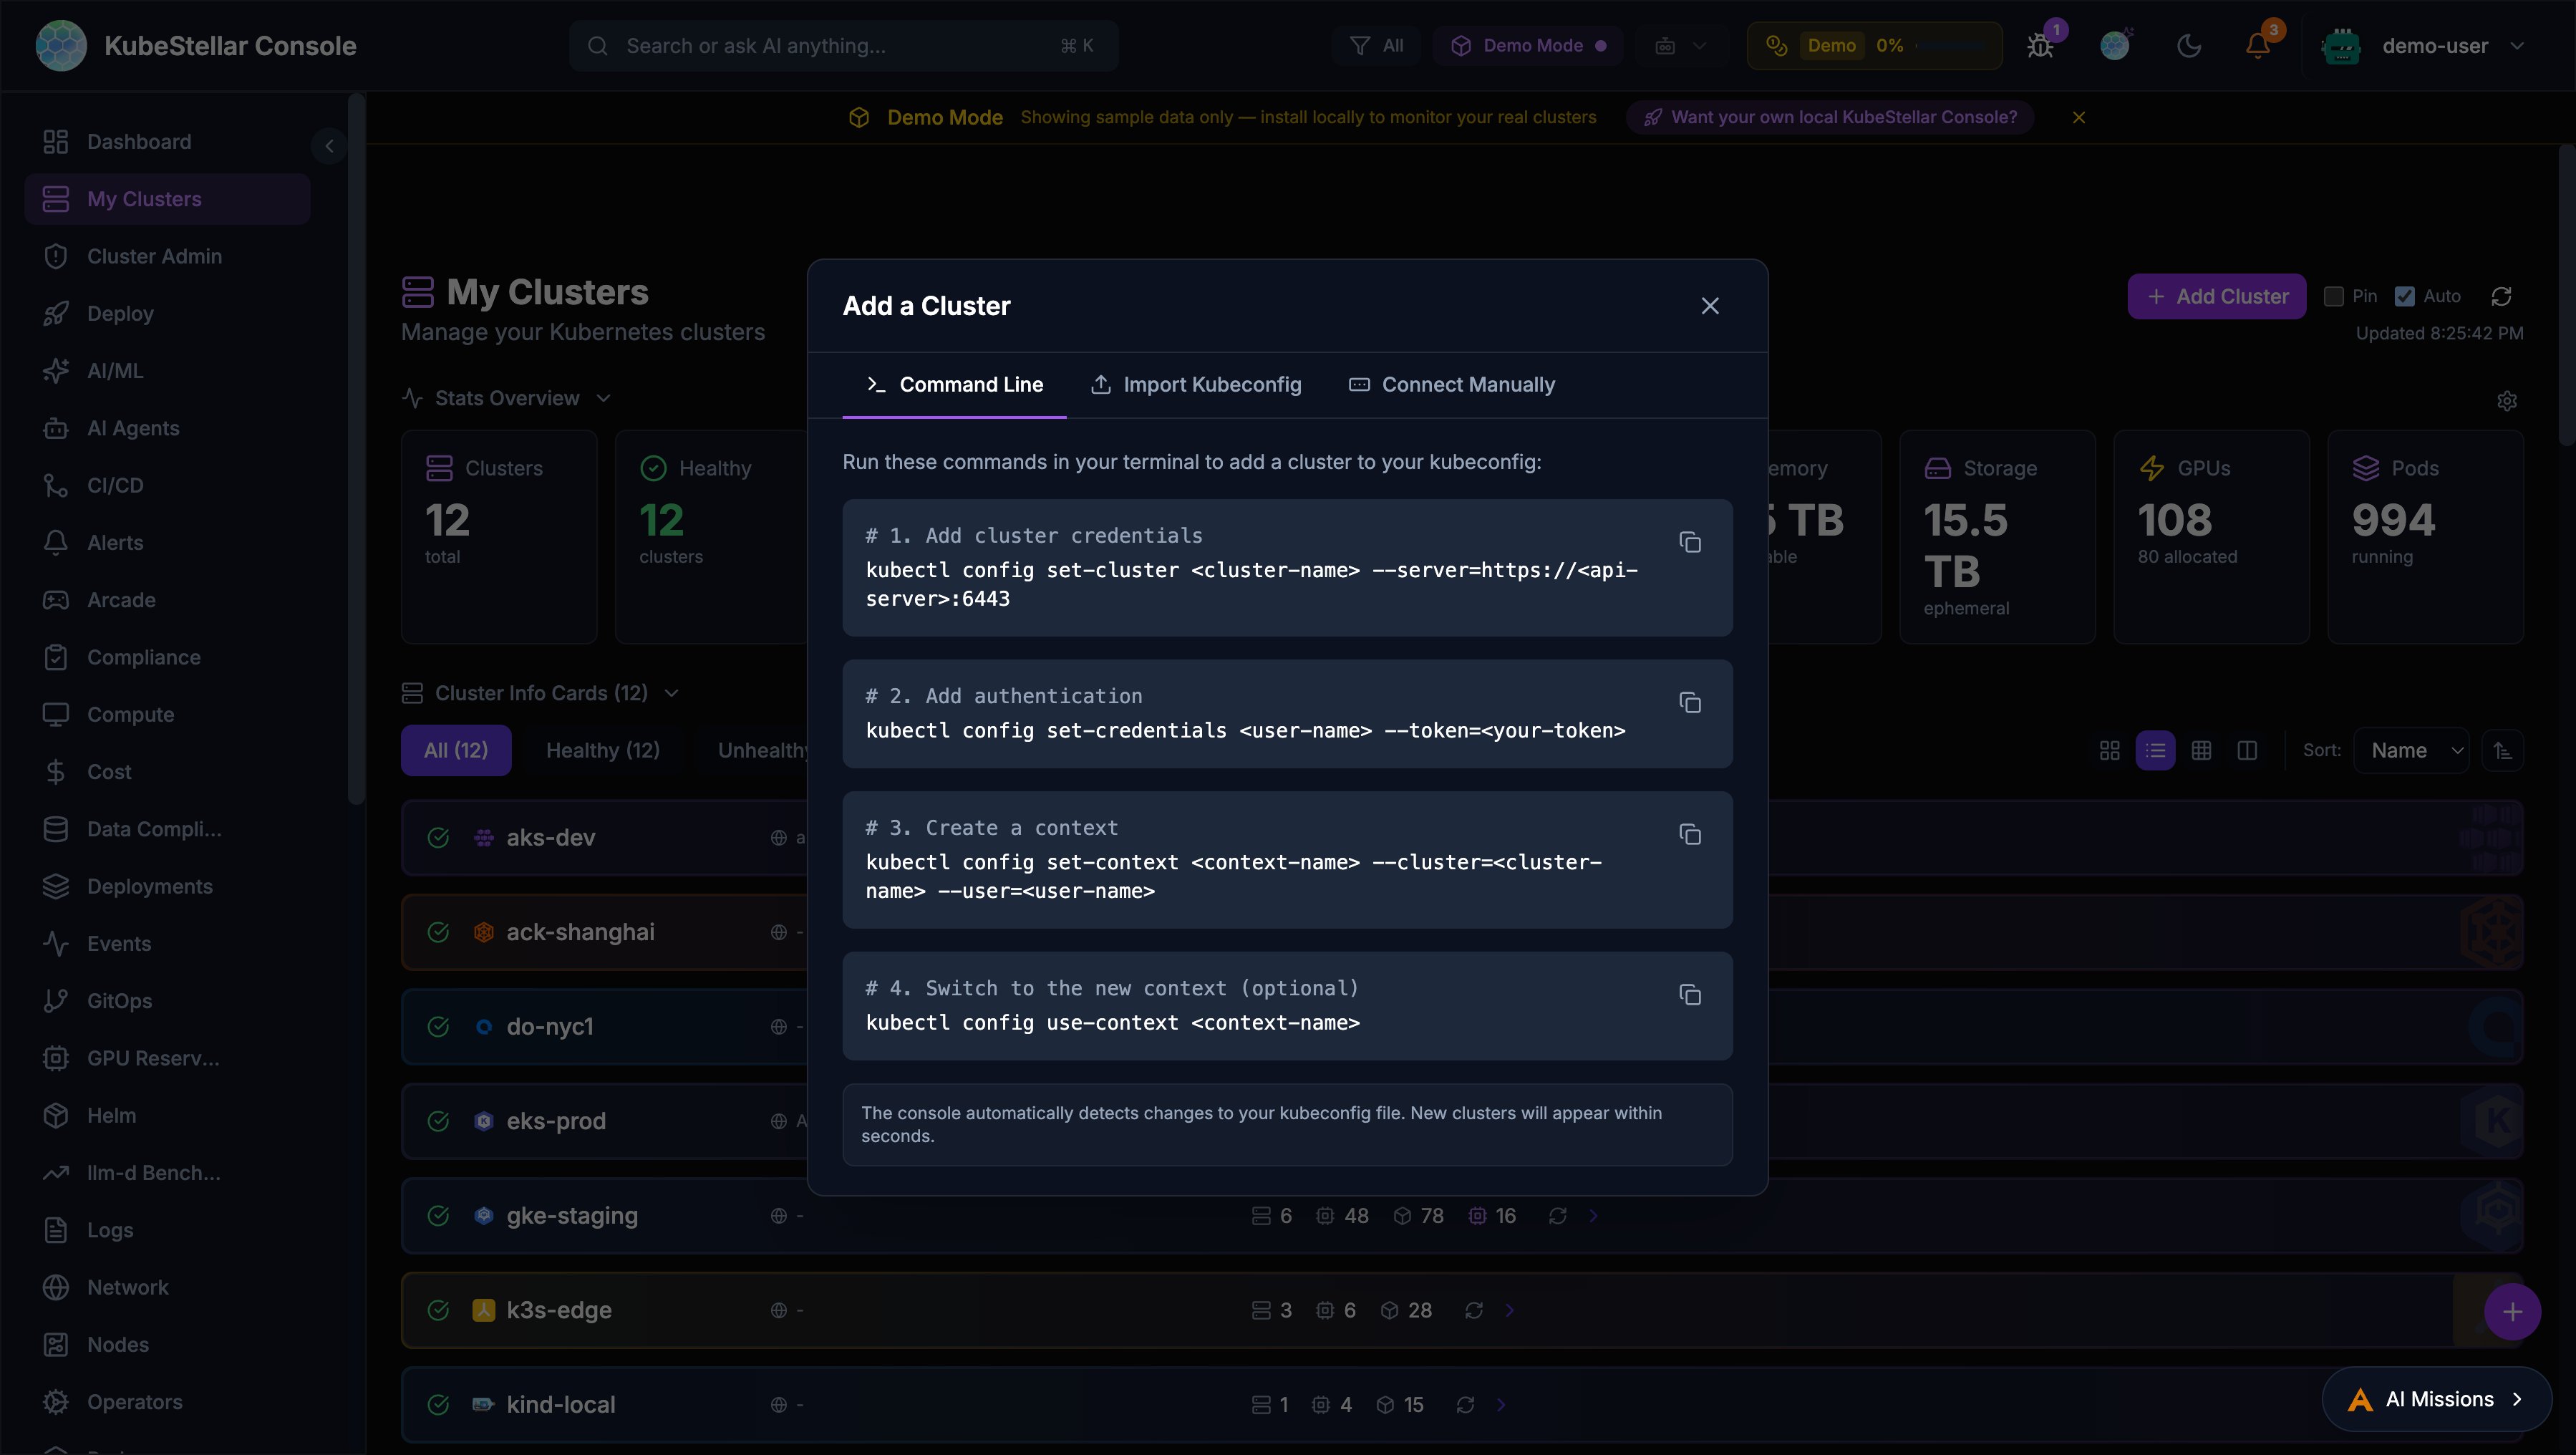
The console now provides a multi-method dialog for adding clusters, accessible from the Add Cluster button on the My Clusters page.
Command Line
Step-by-step kubectl commands with copy buttons:
kubectl config set-cluster— Add cluster credentialskubectl config set-credentials— Add authenticationkubectl config set-context— Create a contextkubectl config use-context— Switch to the new context
The console automatically detects kubeconfig changes and displays new clusters within seconds.
Import Kubeconfig
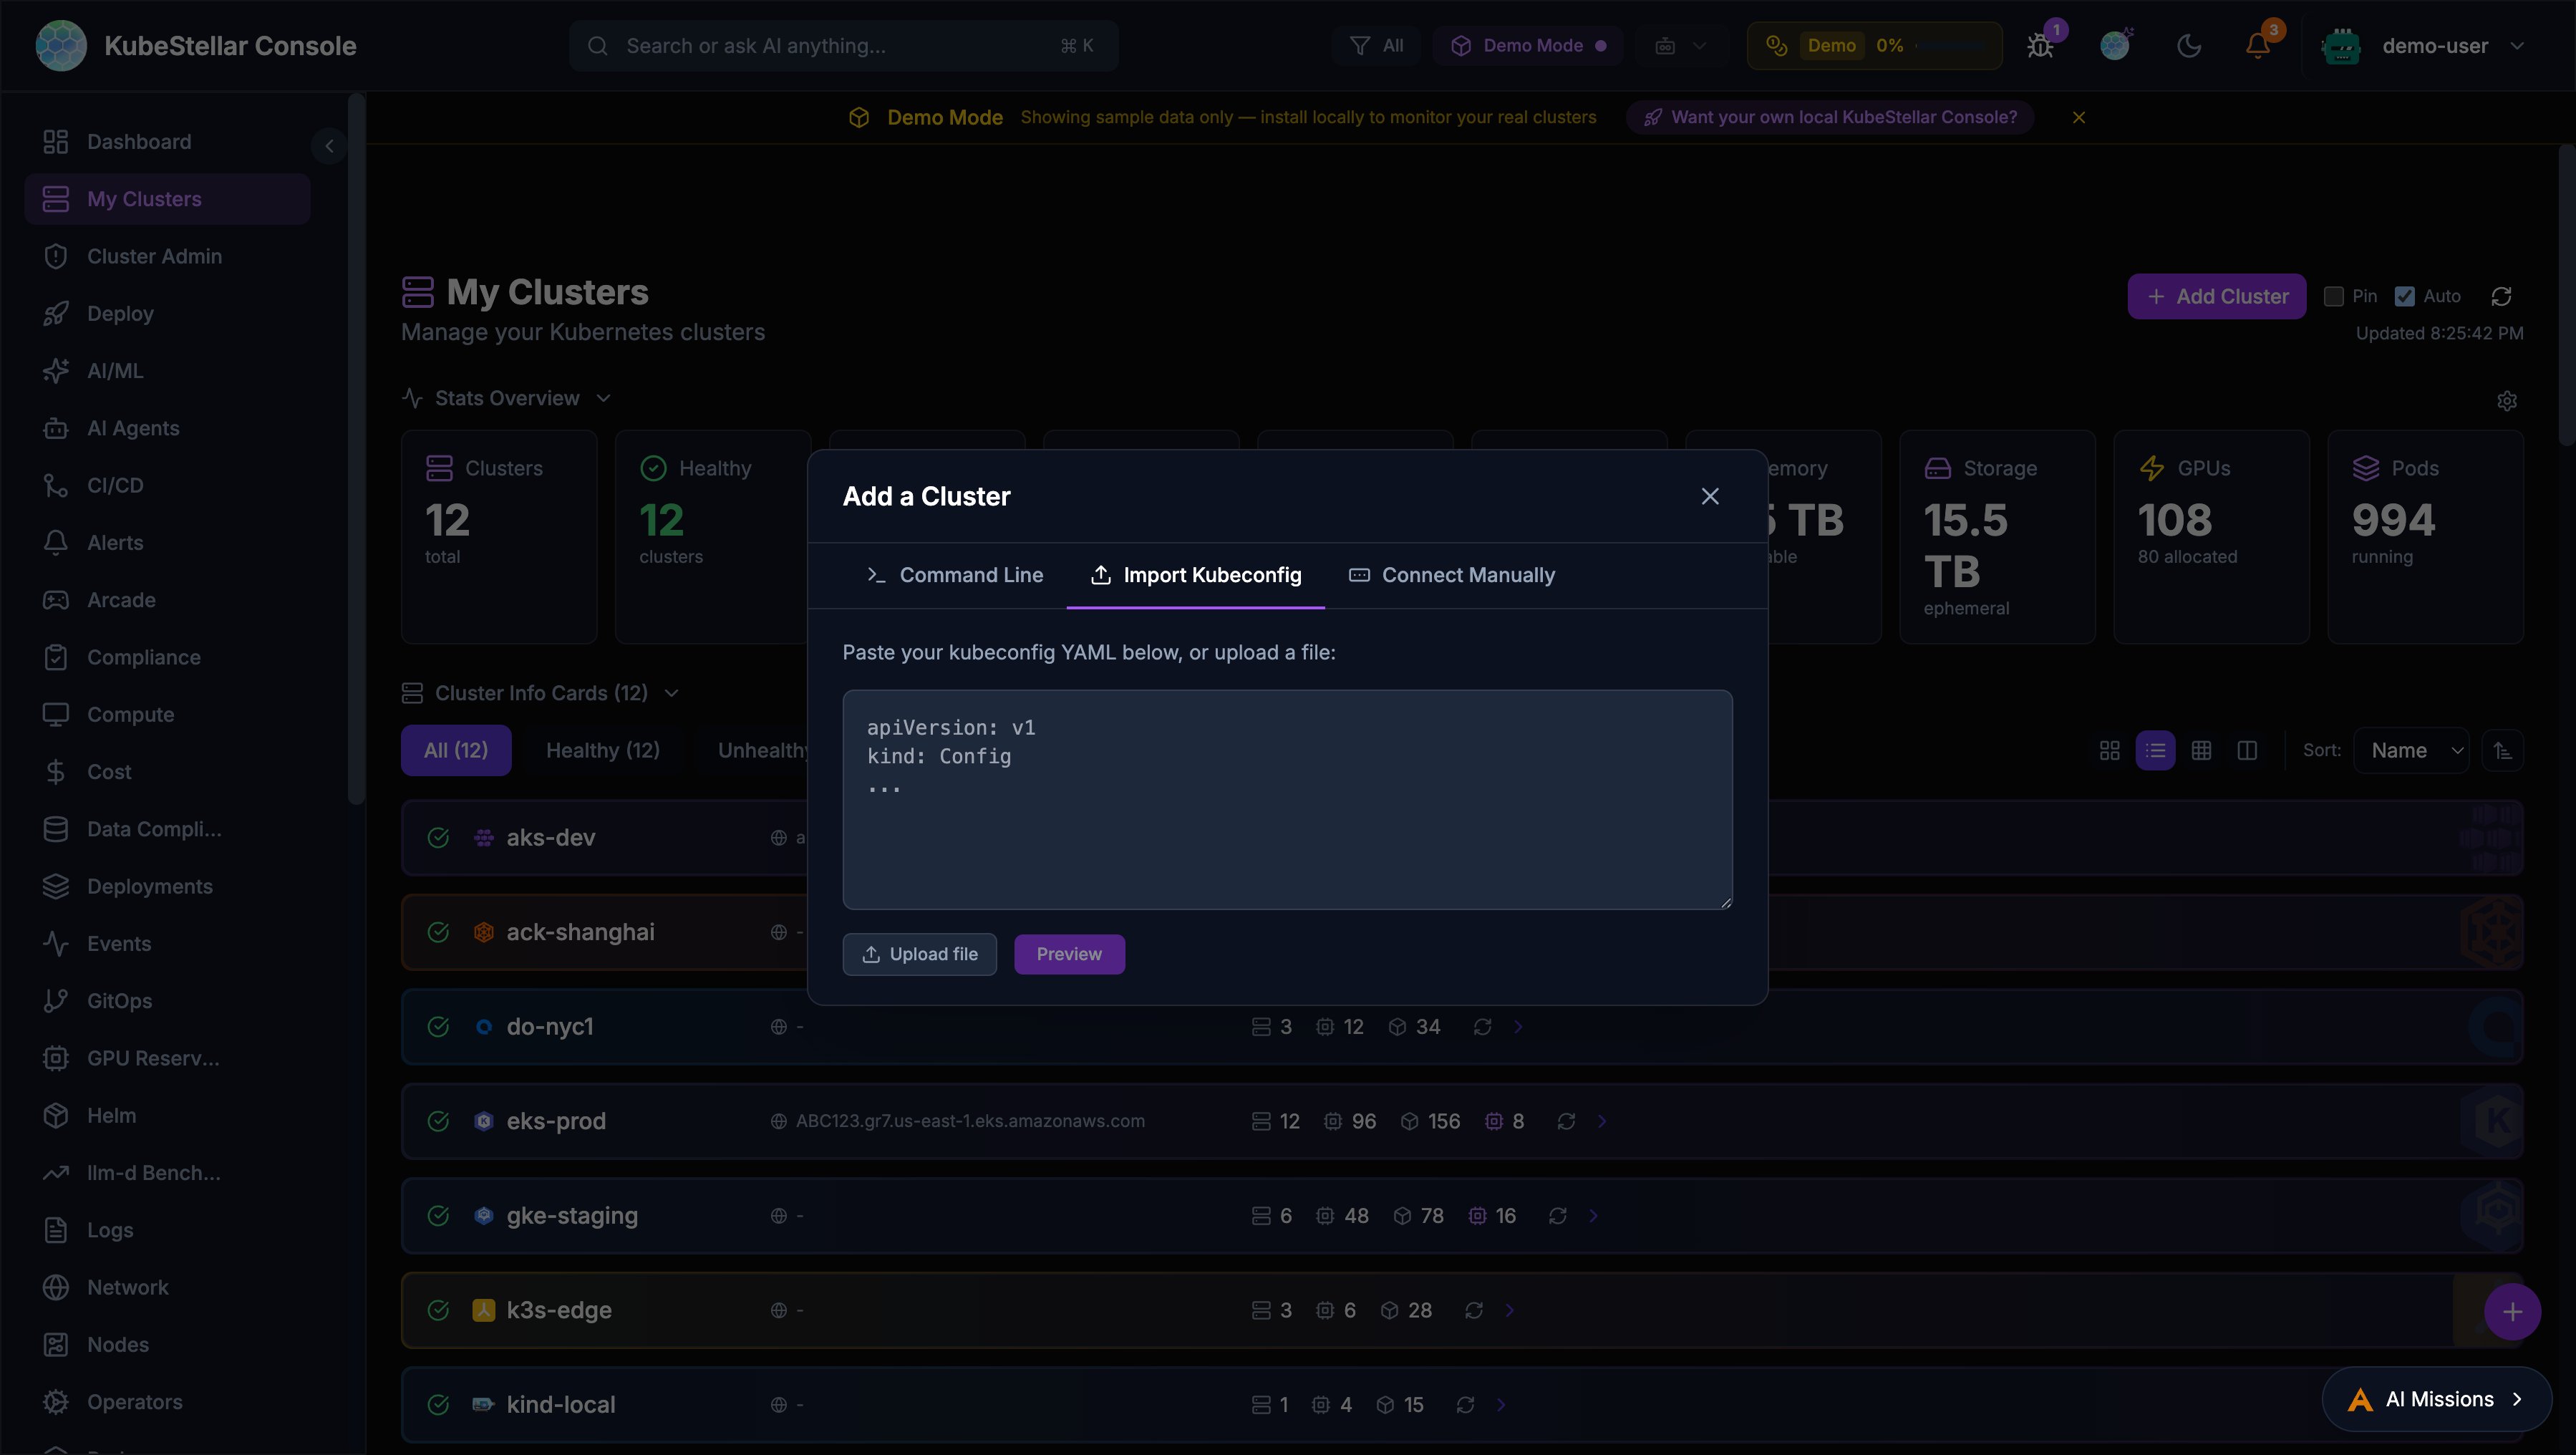
Paste or upload a kubeconfig file to import clusters:
- Preview which contexts are new vs. already existing —click merge into your active kubeconfig
- Automatic backup of your current kubeconfig (
~/.kube/config.bak-<timestamp>) - Requires kc-agent to be connected
Connect Manually
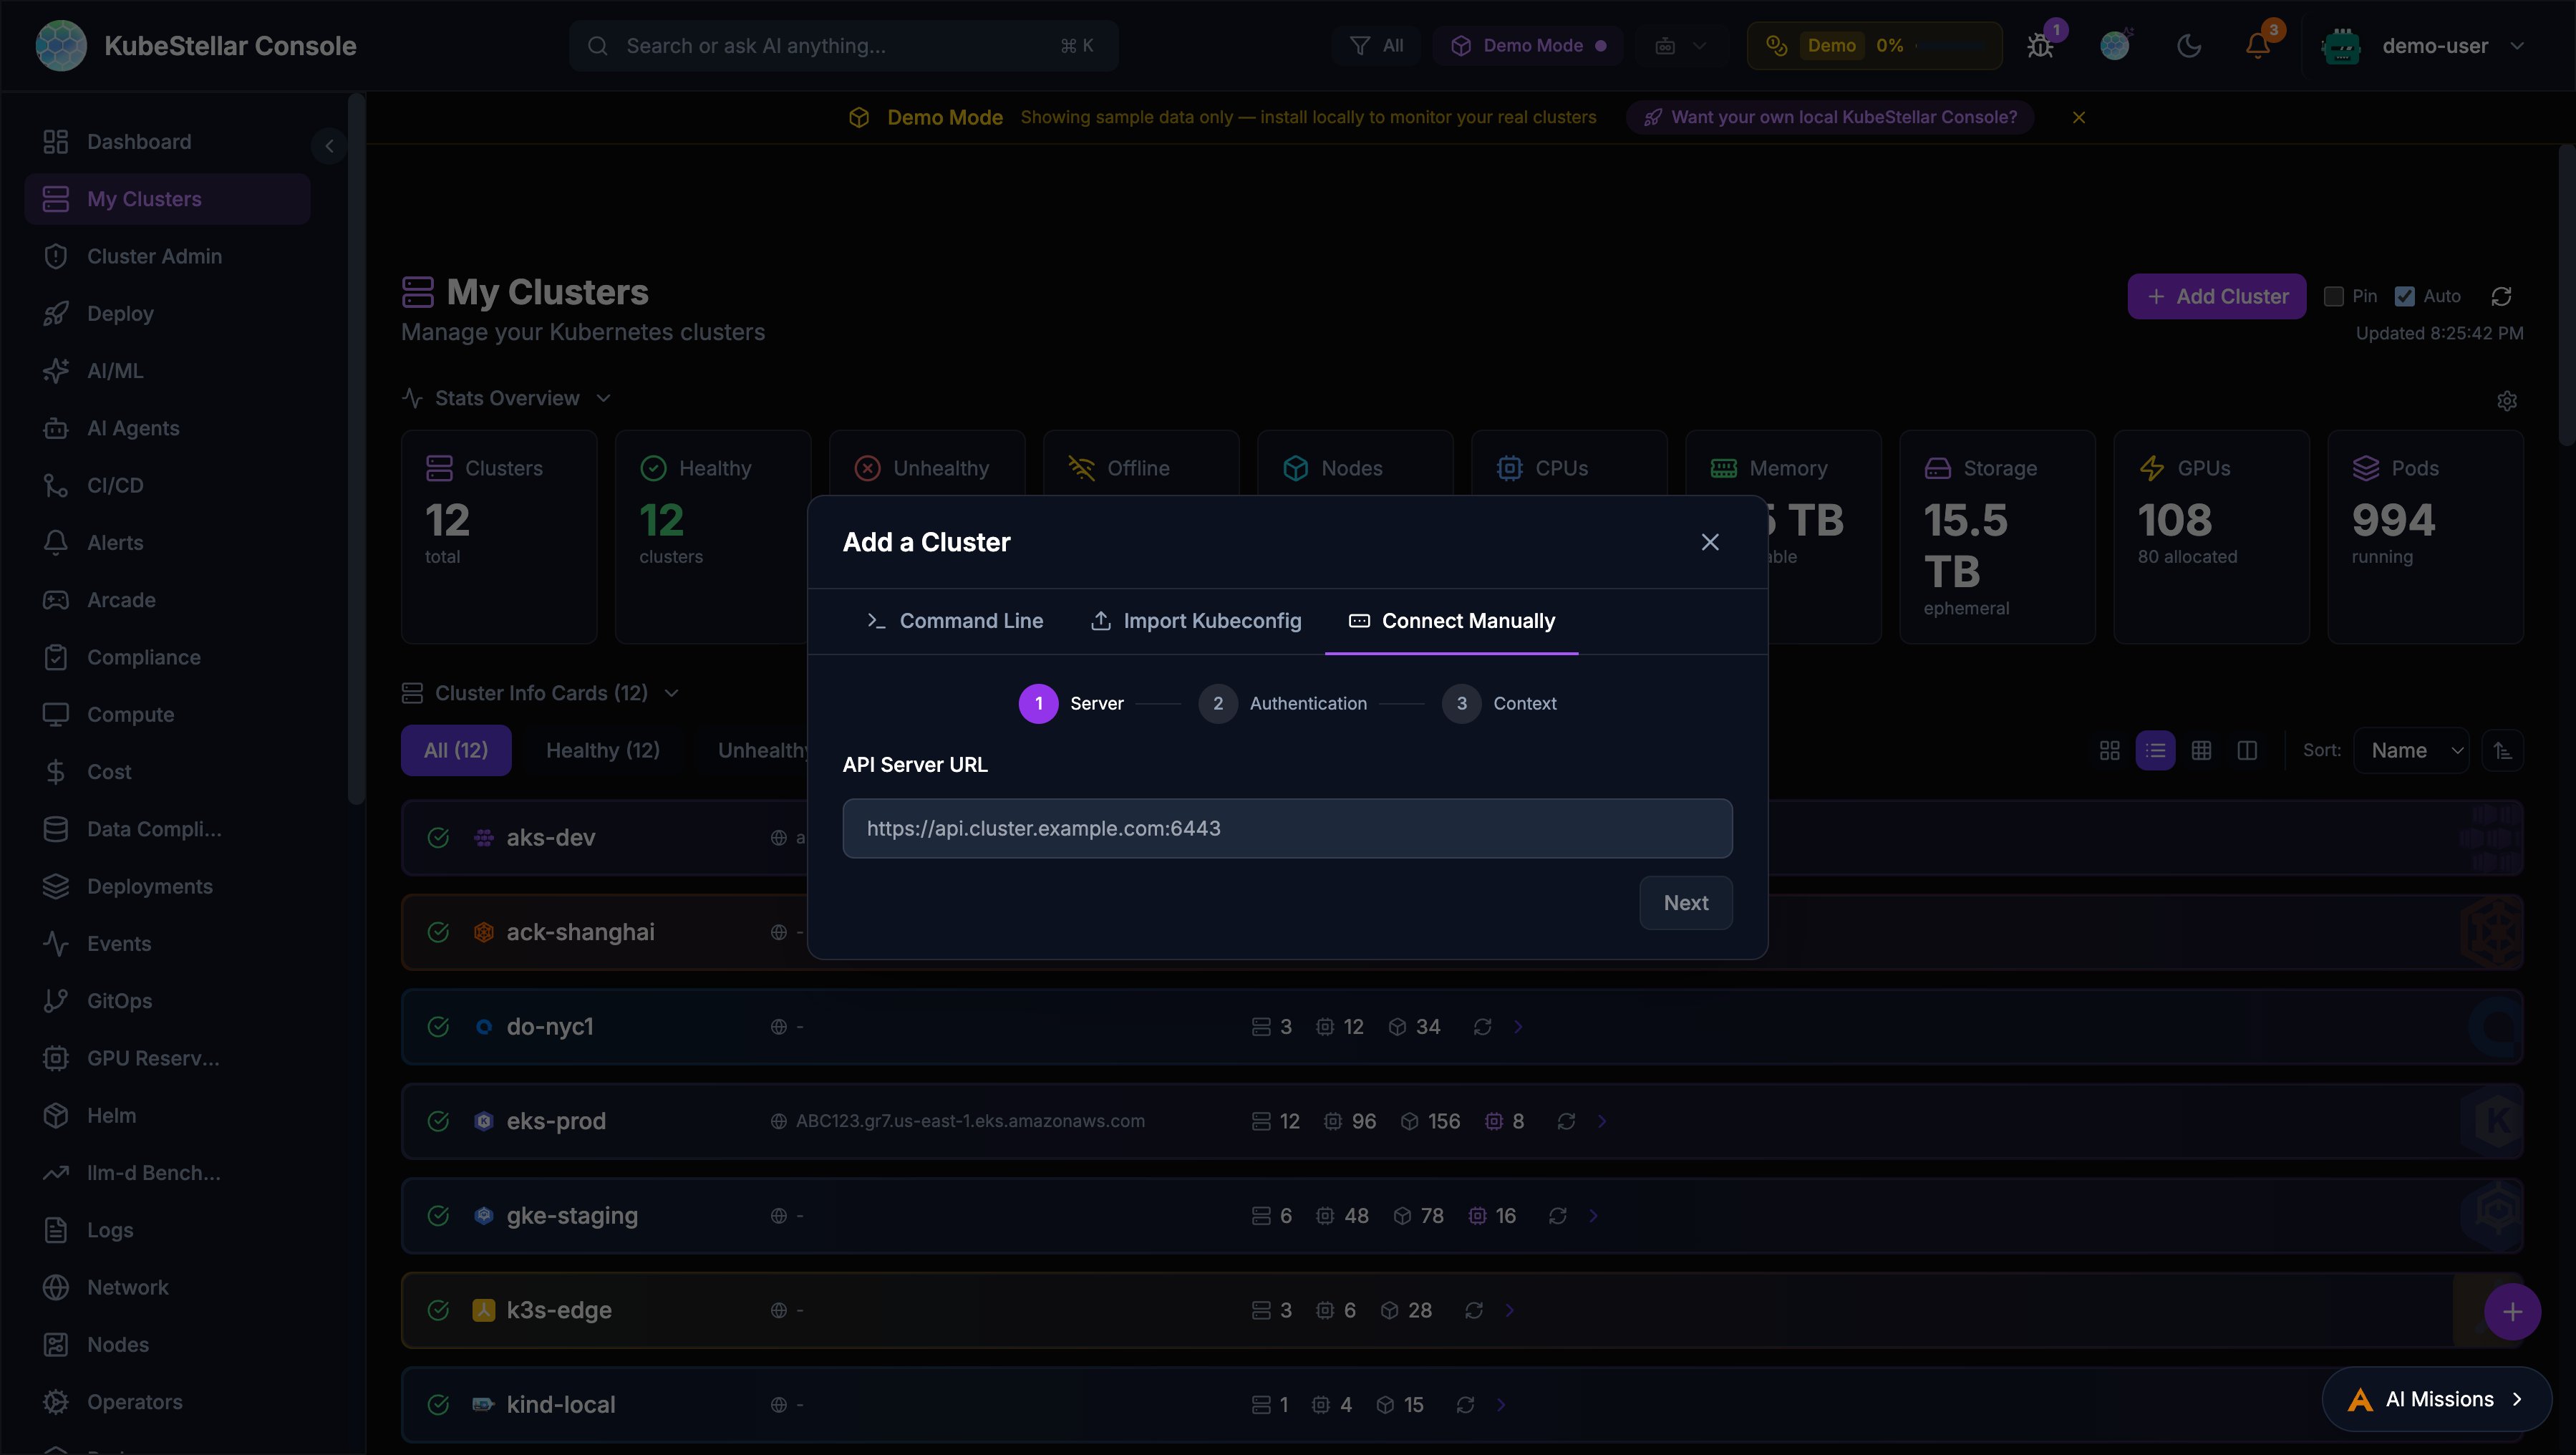
A 3-step wizard for manual cluster connection:
- Server URL: Enter the Kubernetes API server address
- Authentication: Choose between bearer token or client certificate
- Context settings: Name and configure the context
A Test Connection button verifies the cluster is reachable before adding it.
GPU Node Health Monitor
A new Proactive GPU Node Health Monitor card provides comprehensive health checking for GPU nodes across all connected clusters.
Health Check Tiers
The monitor runs checks at four configurable tiers:
| Tier | Name | What It Checks |
|---|---|---|
| Tier 1 | Critical | Node ready, cordoned status, stuck pods, NVIDIA operator pods, GPU reset/XID events |
| Tier 2 | Standard | + Capacity vs allocatable mismatch, pending GPU pods, pressure conditions |
| Tier 3 | Full | + Zero utilization, MIG drift, RDMA pods, failed jobs, evicted pods |
| Tier 4 | Deep | + nvidia-smi (ECC errors, temperature), dmesg GPU kernel errors, NVLink status |
CronJob Management
Install and manage GPU health check CronJobs directly from the card:
- Configure target namespace and cron schedule
- Install/uninstall per cluster
- Results stored in ConfigMaps with version stamps
- RBAC-aware: authorized users see install/uninstall buttons
Alert Integration
GPU health issues integrate with the alert system:
gpu_health_cronjobcondition type- Browser notifications with deep-link to affected nodes
- AI Diagnose button for automated troubleshooting
Accessibility (WCAG 2.1 AA)
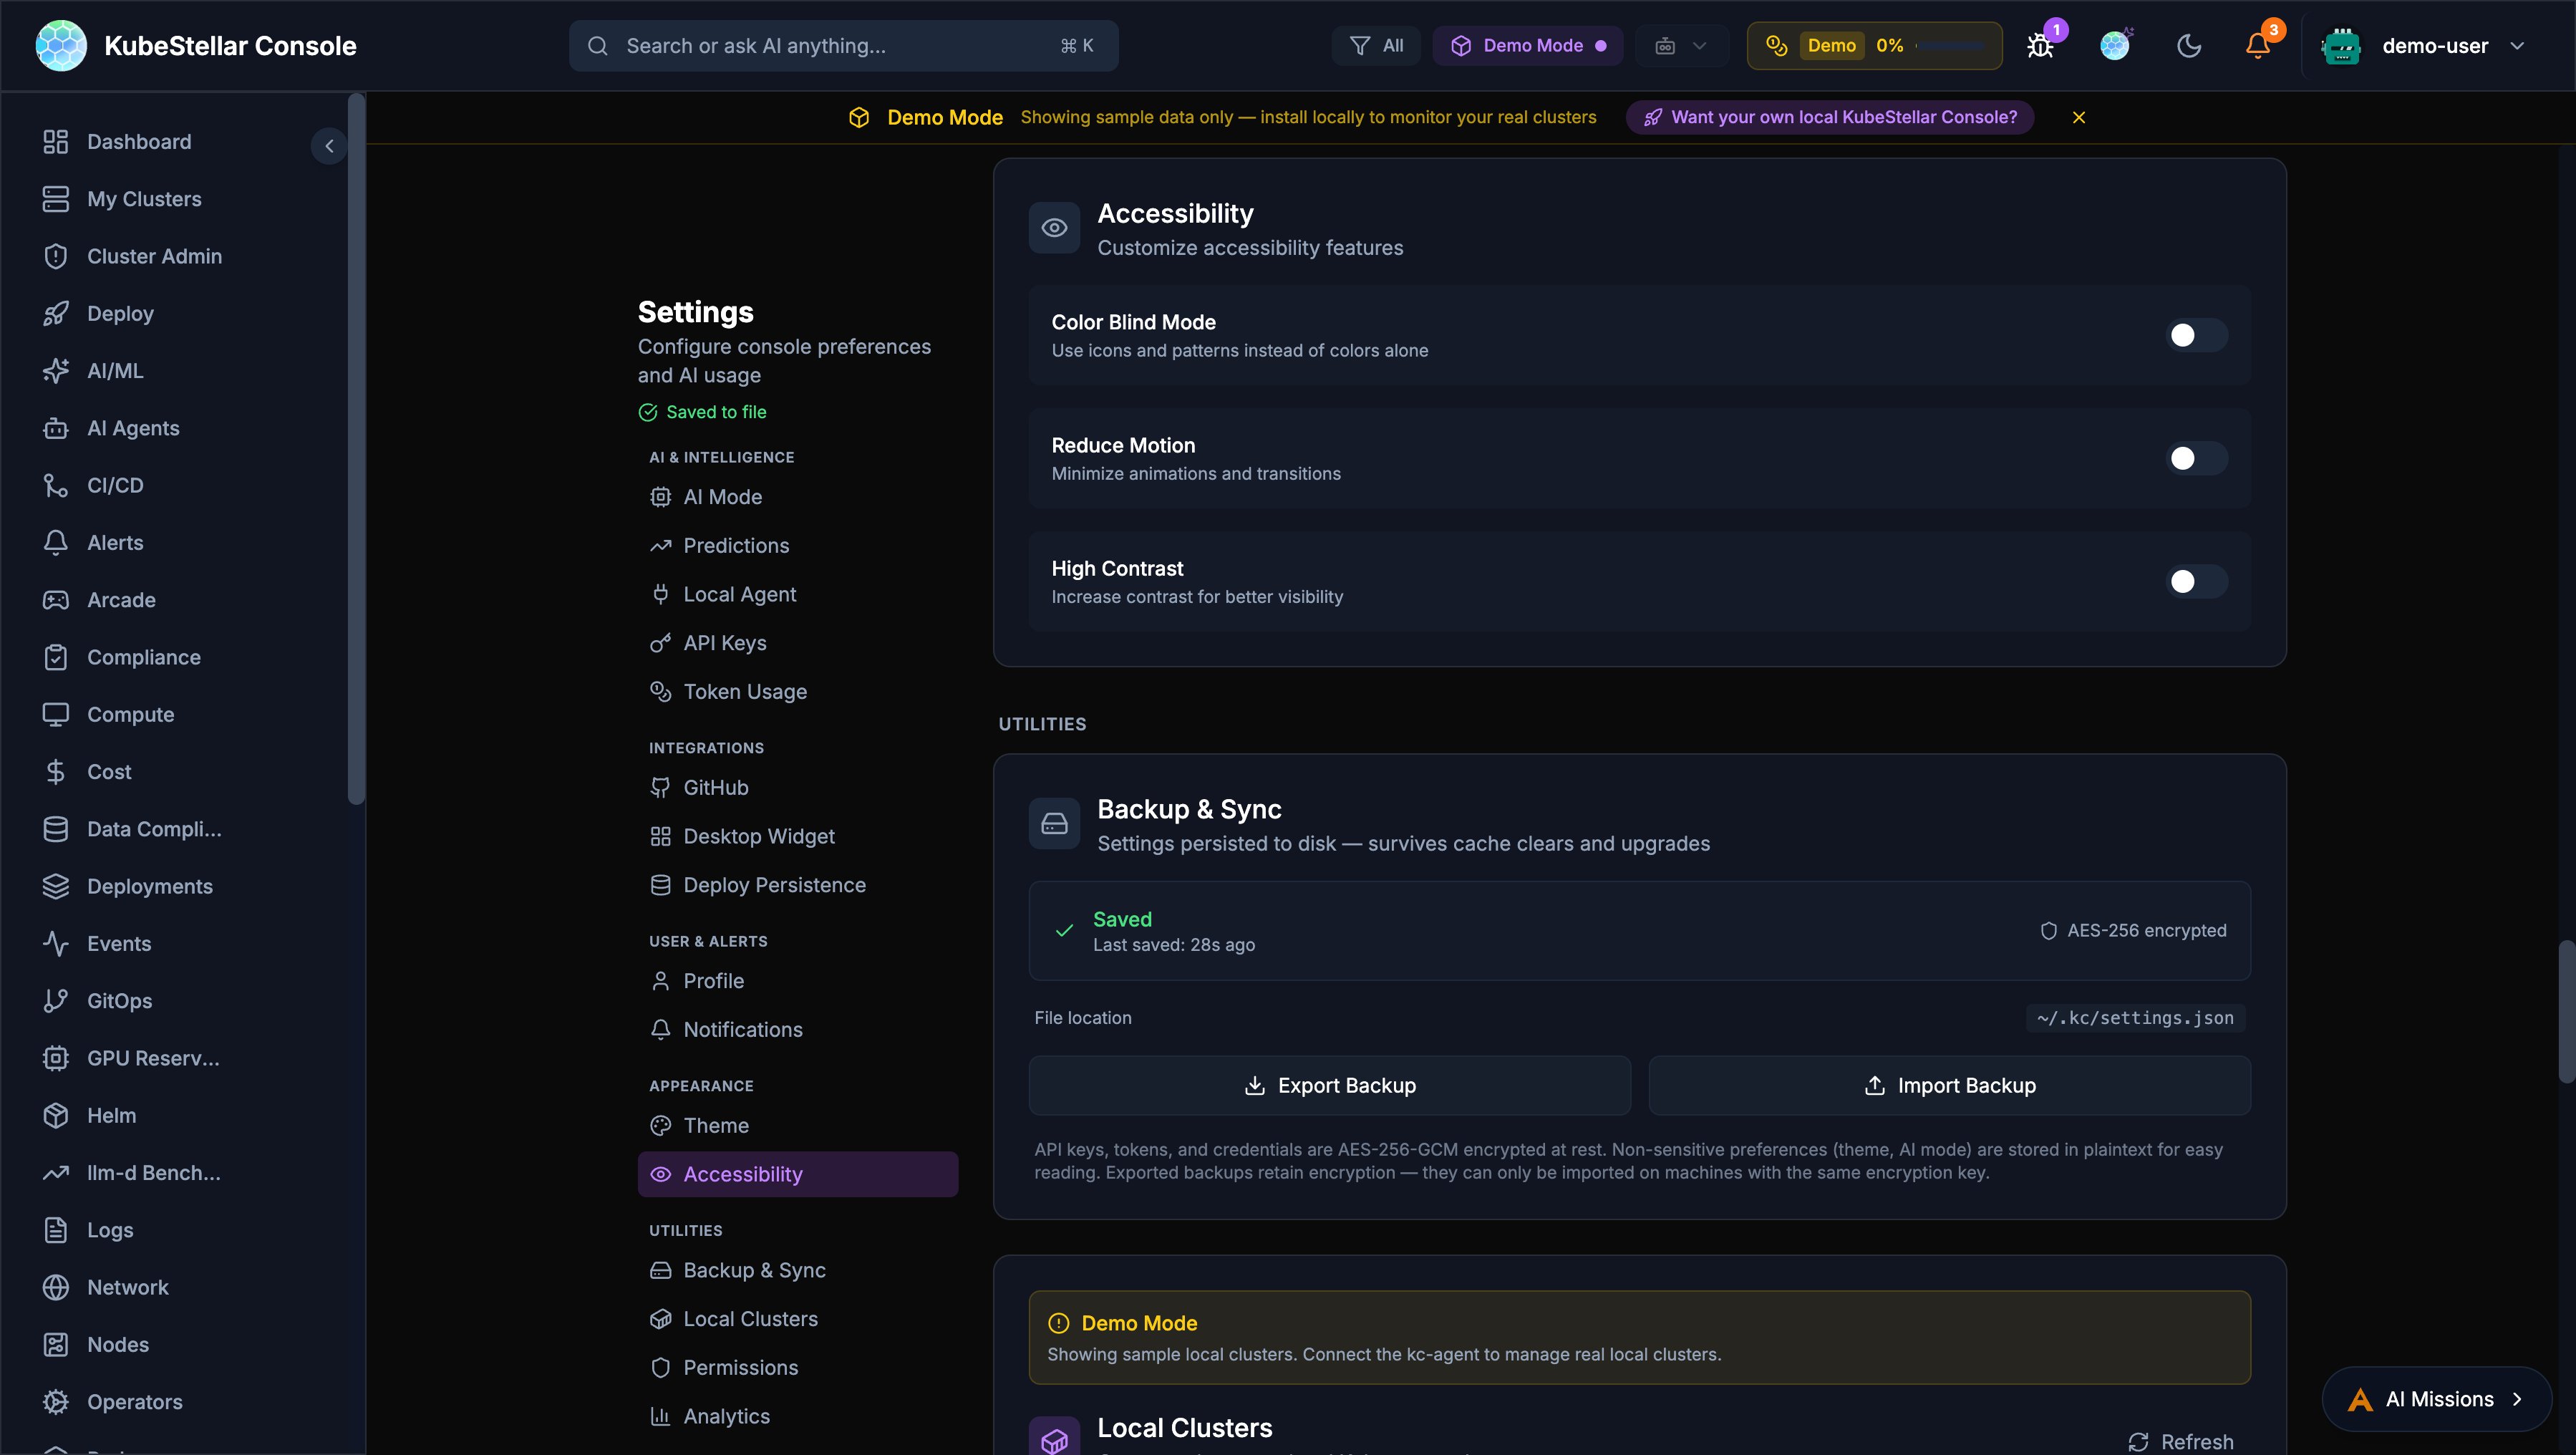
The console now meets WCAG 2.1 AA accessibility standards with three phases of improvements.
Keyboard Navigation
- Tab: Navigate between dashboard cards with visible focus rings
- Enter/Space: Open expanded card view
- Arrow keys: Navigate the card grid
- Escape: Close modals with automatic focus restoration
- Skip-to-content: Press Tab on page load to skip navigation
Screen Reader Support
- ARIA live regions announce dynamic content changes (demo/live badges, failure indicators, refresh status)
- Accessible names on cluster status badges, run dots, and chart containers
- Semantic ARIA landmarks for page regions
- Card menus use
role="menu"androle="menuitem"
Visual Accessibility
Configure in Settings > Appearance > Accessibility:
- Color blind mode
- Reduce motion
- High contrast mode
GA4 Product Telemetry
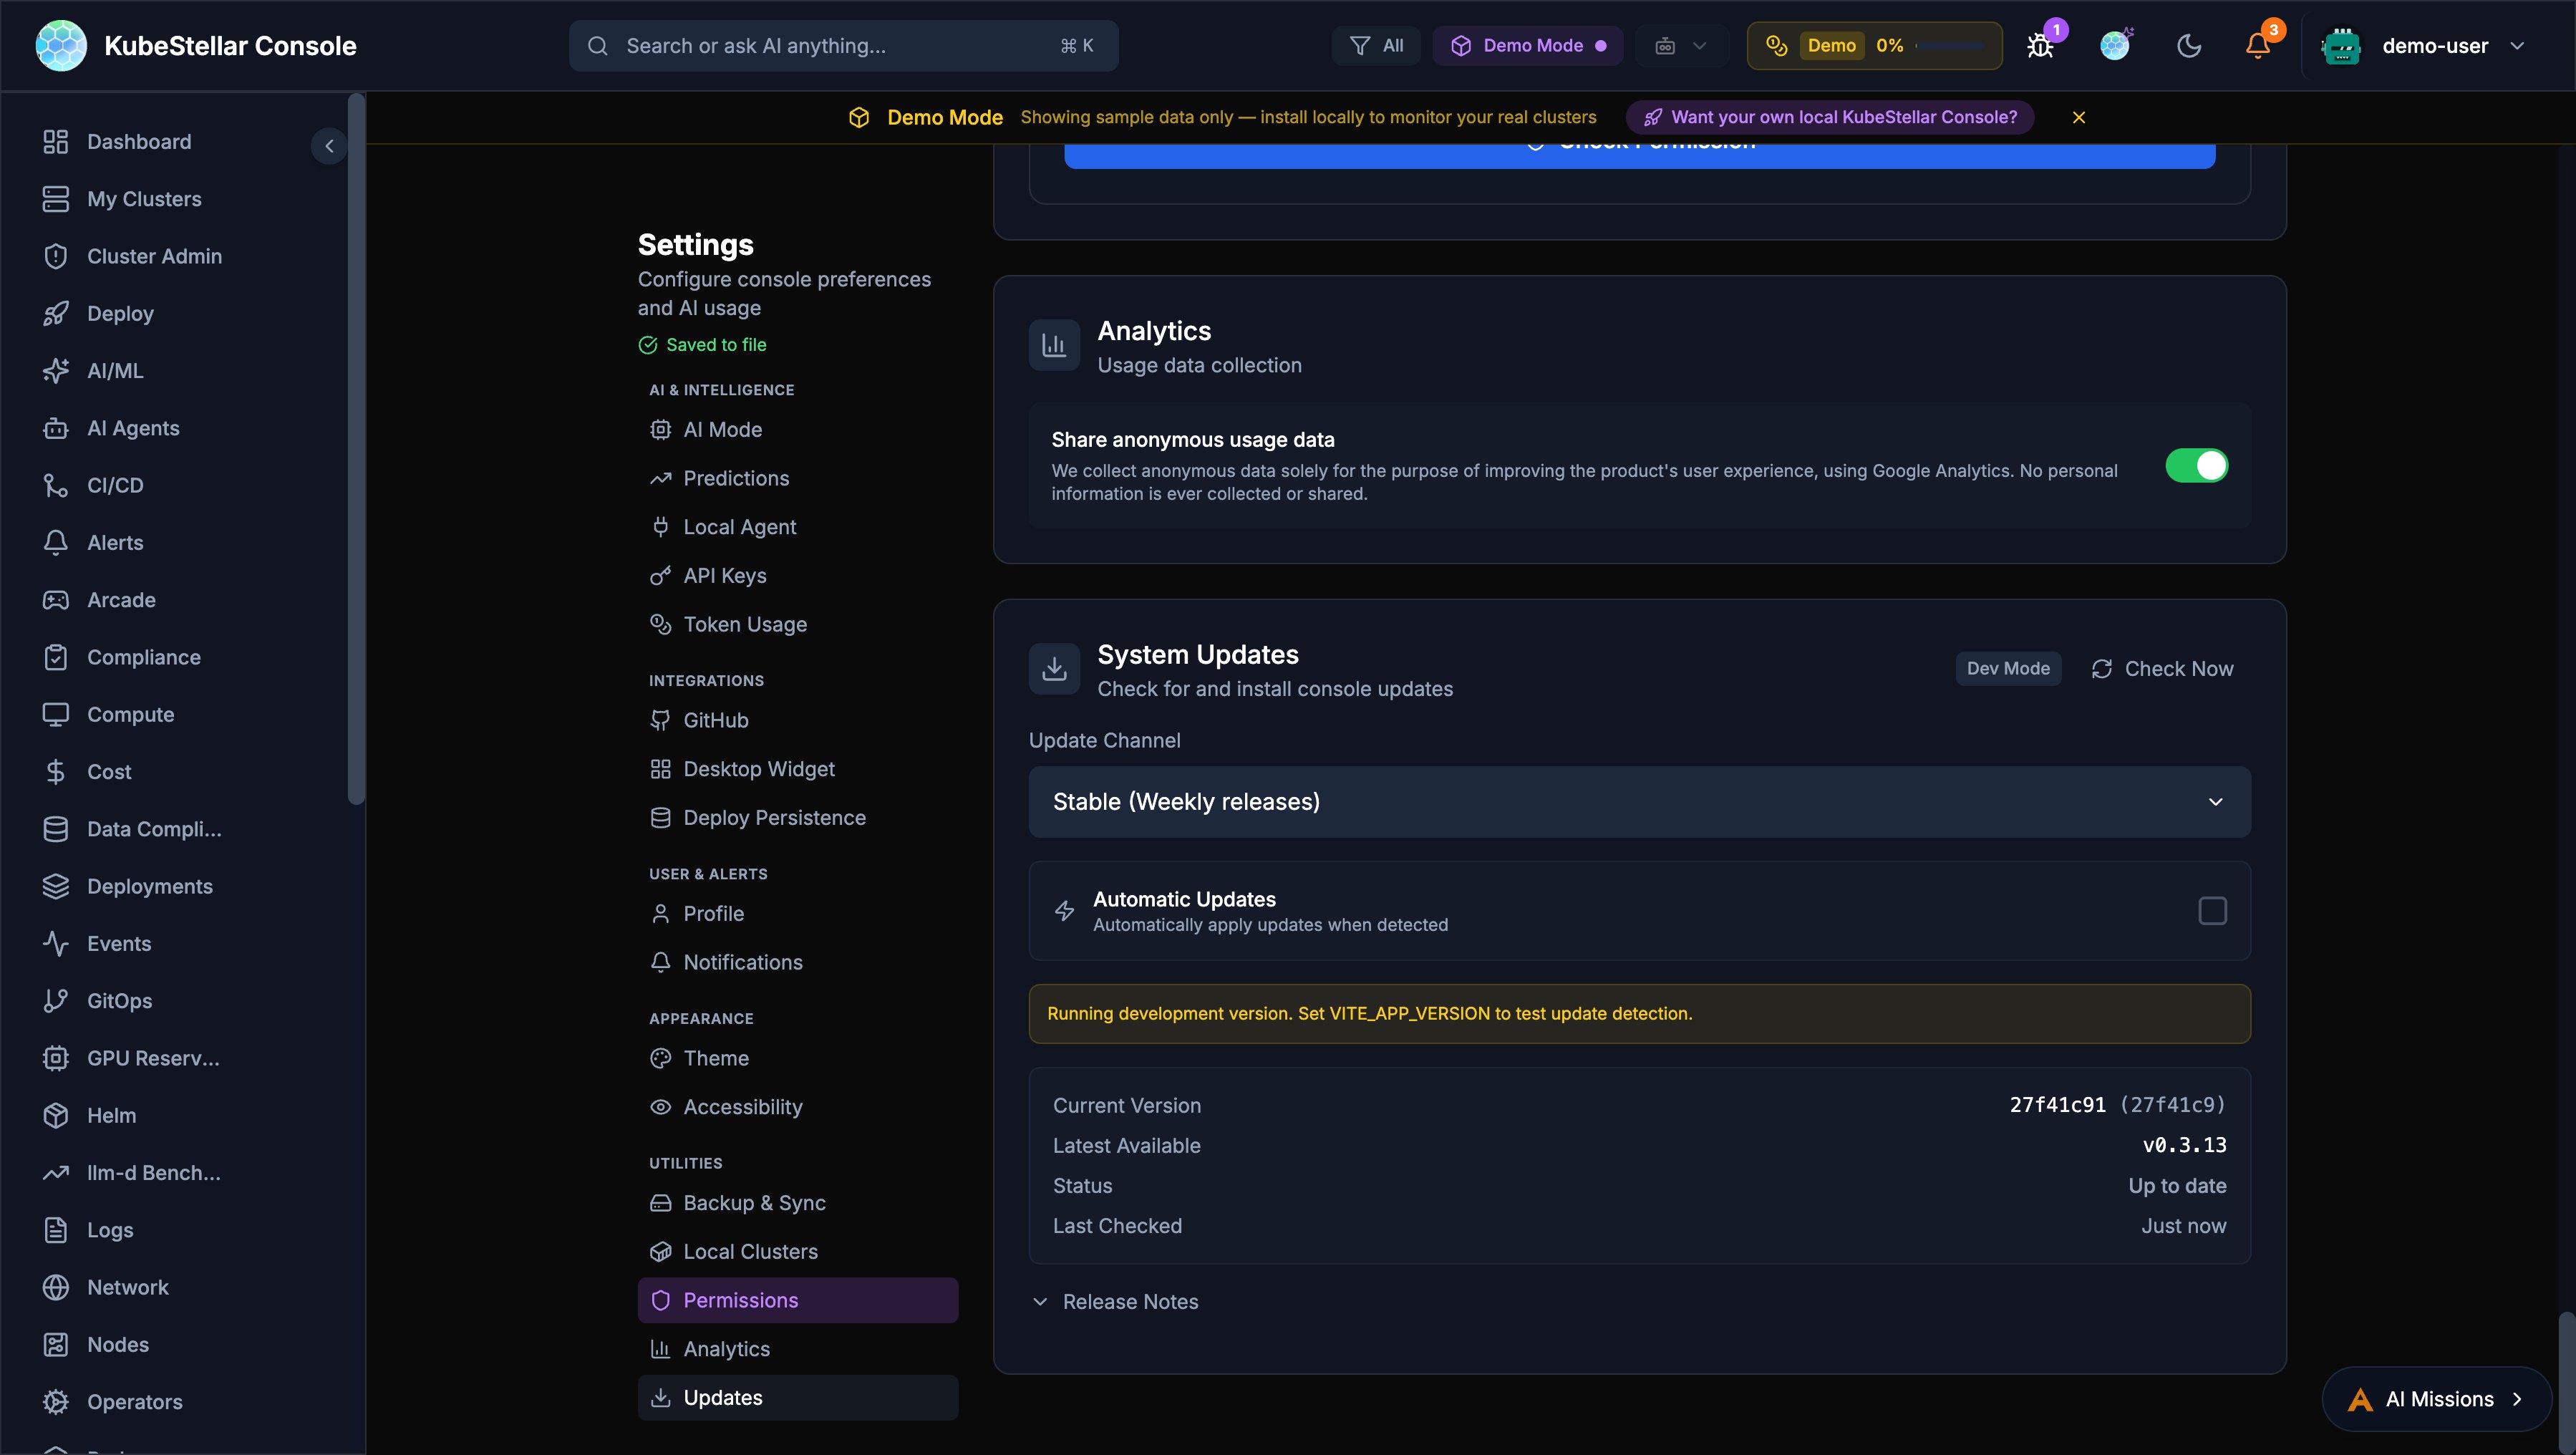
Anonymous Google Analytics 4 telemetry helps improve the product experience.
What Is Collected
- Page views and navigation patterns
- Card interactions (add, remove, drag, expand, configure)
- AI mission lifecycle events
- Auth events and tour progress
- All events prefixed with
ksc_— no PII is collected
Opting Out
Navigate to Settings > Analytics and toggle the analytics switch off.
Admin Configuration
Set the GA4 measurement ID via environment variable:
VITE_GA_MEASUREMENT_ID=G-XXXXXXXXXXAI Coding Agent Providers
The console now supports 17+ AI coding agent providers with a mixed-mode architecture.
Supported Providers
| Category | Providers |
|---|---|
| CLI Agents | Claude Code, Codex, Gemini CLI, Antigravity, Bob |
| IDE Agents | GitHub Copilot, Cursor, VS Code, Windsurf, JetBrains, Zed |
| API Agents | Claude Desktop, Open WebUI, Raycast |
| Frameworks | Cline, Continue |
Mixed-Mode Architecture
API agents (thinking) and CLI agents (execution) can work together:
- API agent reasons about the task
- CLI agent executes tools and commands
- API agent analyzes results
Provider capabilities are defined by a bitmask: Chat (1), ToolExec (2), or both (3).
Contribute Dialog
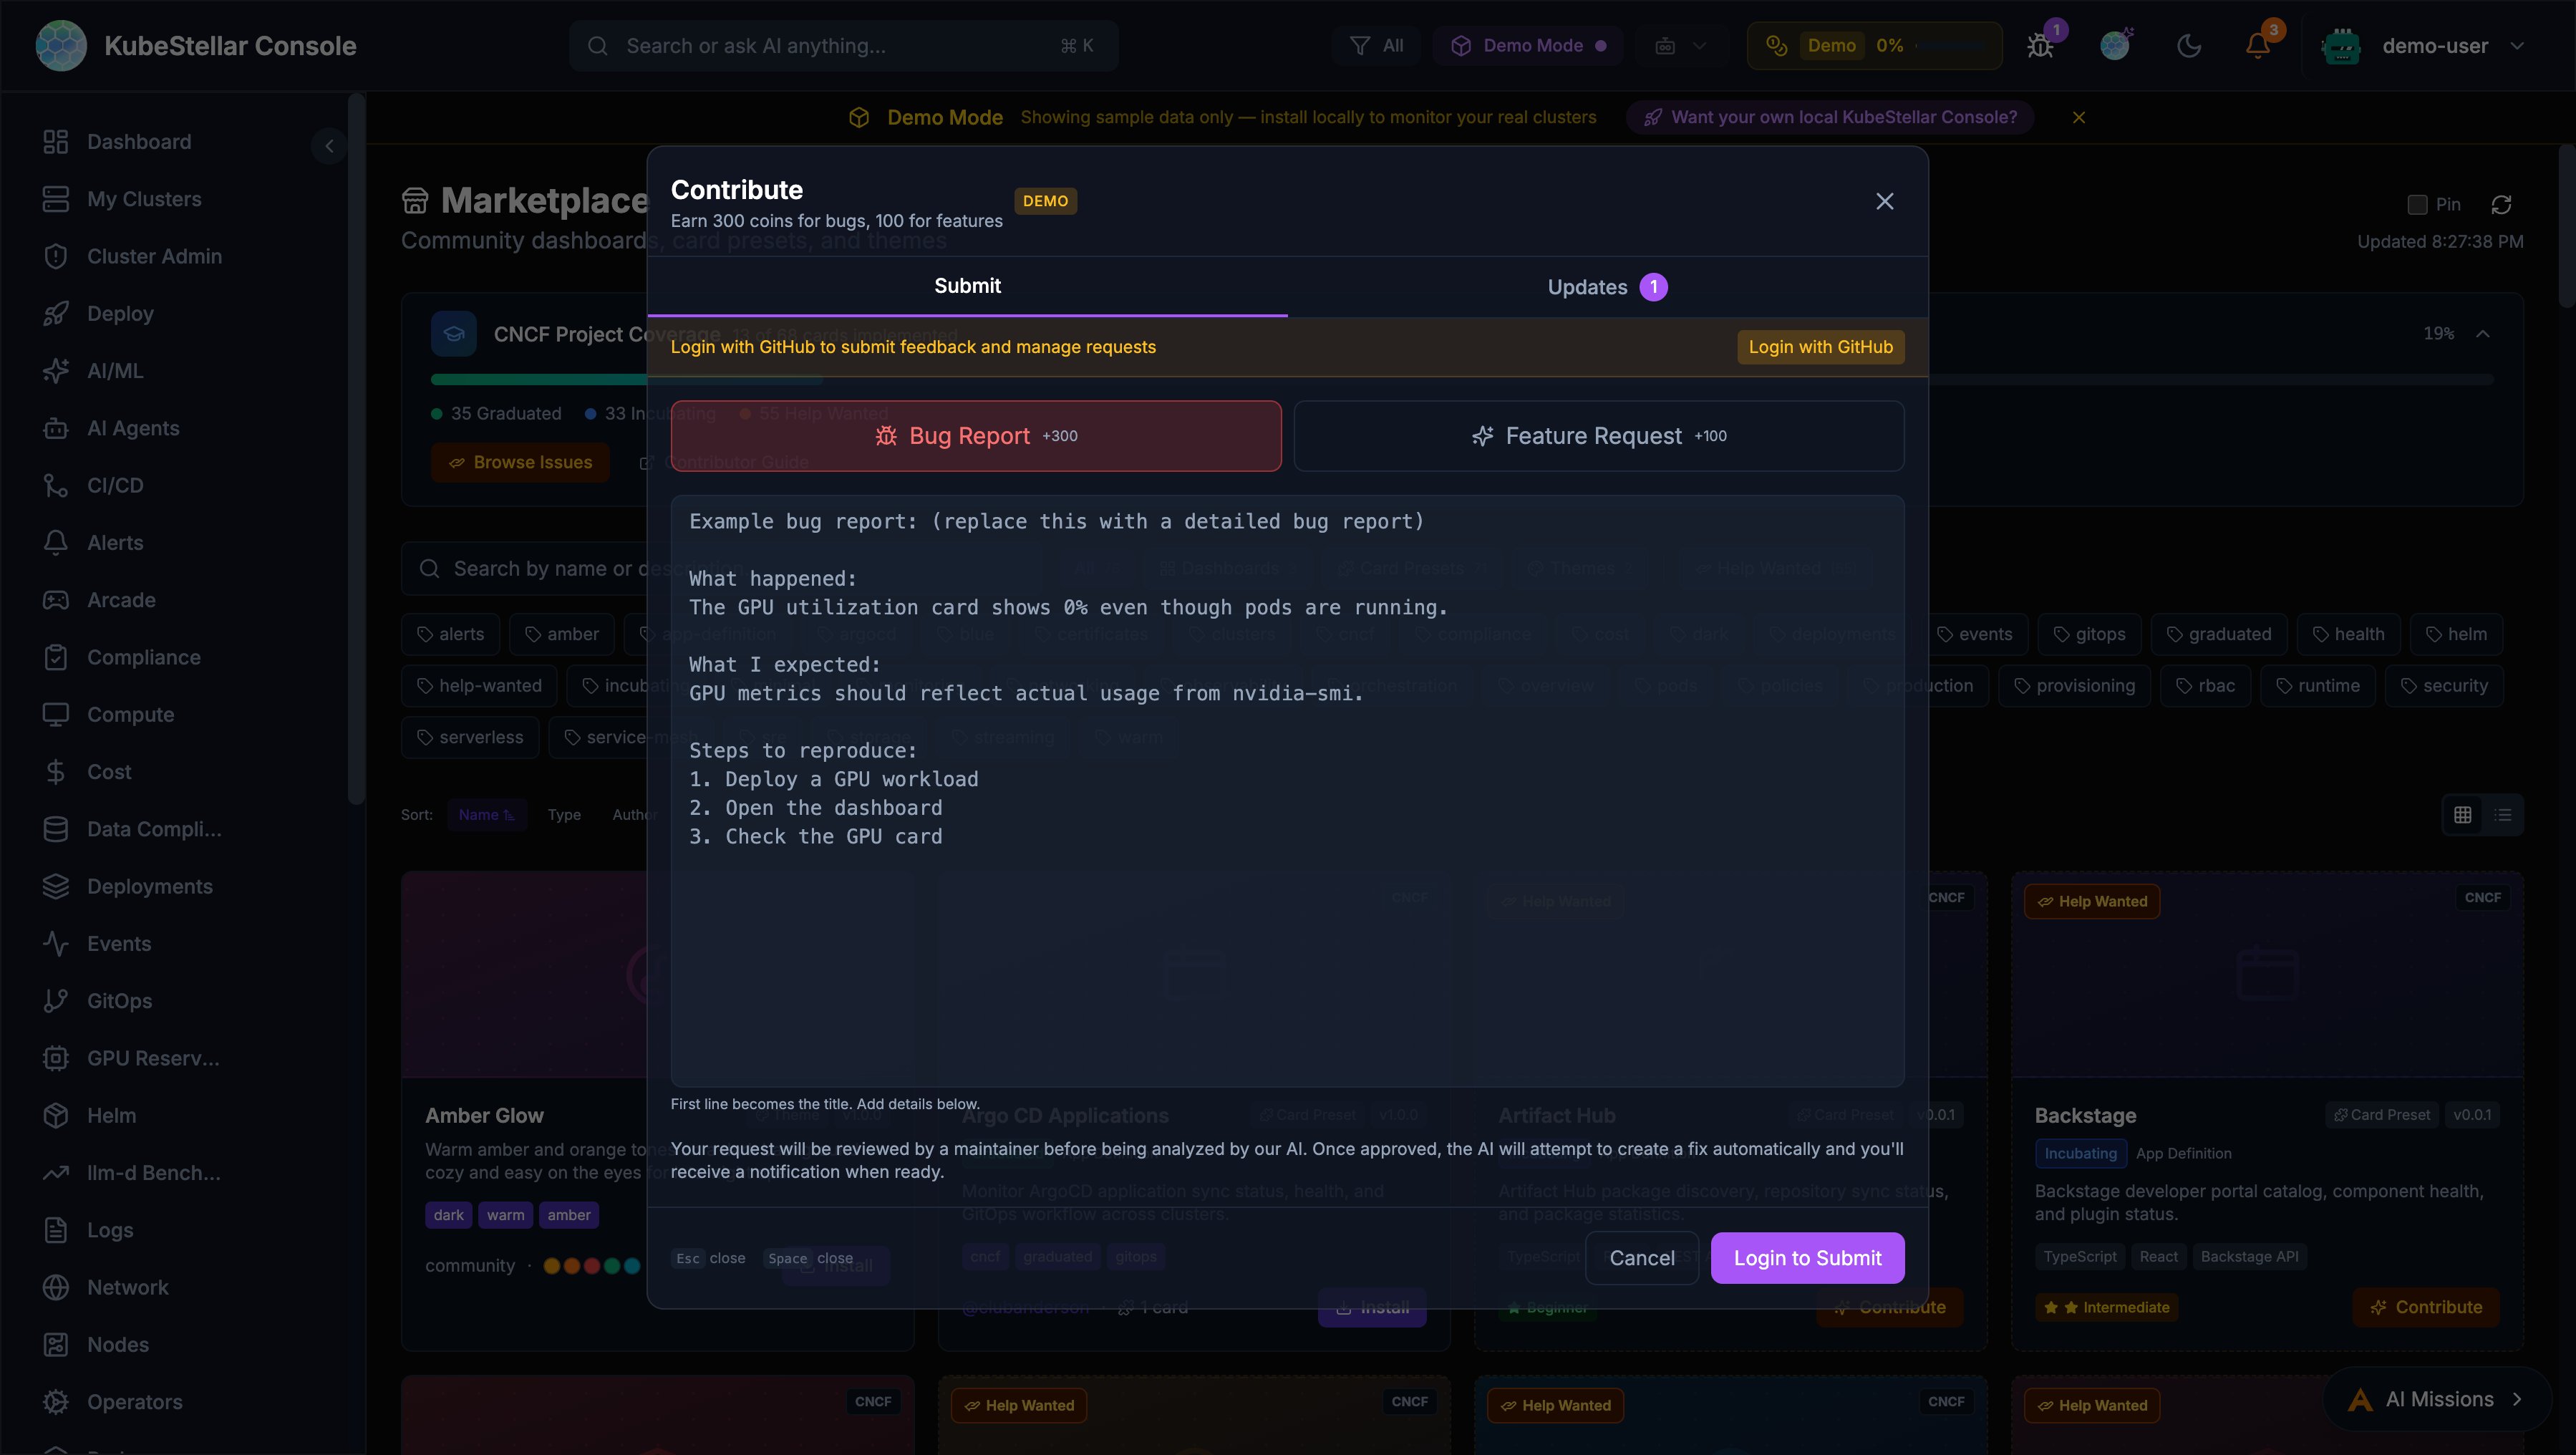
The feedback system has been redesigned as a unified Contribute dialog.
Entry Points
- Navbar bug icon: Opens the Contribute dialog
- Per-card bug button: Every card toolbar now has a bug report icon that pre-fills context
- Profile dropdown: “Contribute” menu item
Submit Tab
- Bug Report (+300 coins) and Feature Request (+100 coins)
- First line auto-extracts as title
- Enlarged textarea with example prompts
- Submissions open GitHub issues for tracking
Updates Tab
Merged view of your requests, notifications, and GitHub contributions in a single scrollable list.
GitHub Activity Rewards
Earn coins from GitHub activity across kubestellar and llm-d organizations:
| Activity | Coins |
|---|---|
| Bug issue opened | 300 |
| Feature issue opened | 100 |
| Other issue opened | 50 |
| PR opened | 200 |
| PR merged | 500 |
Contributor Ladder
An 8-tier progression system rewards sustained community contributions:
| Tier | Level | Coin Threshold |
|---|---|---|
| 1 | Observer | 0 |
| 2 | Participant | 100 |
| 3 | Contributor | 500 |
| 4 | Active Contributor | 1,500 |
| 5 | Reviewer | 5,000 |
| 6 | Maintainer | 15,000 |
| 7 | Lead | 50,000 |
| 8 | Legend | 150,000 |
Your level badge appears in the profile dropdown with a progress bar showing advancement toward the next tier.
Marketplace Author Profiles
Marketplace items now display author attribution:
- GitHub handle: Linked
@handlewith profile URL - Hover cards: Show GitHub avatar, coin count (100 coins per merged PR), and per-repo PR breakdown
- Grid view: Full hover card on author name
- List view: Compact clickable link
Flatcar Container Linux Card
A new Flatcar Container Linux Status card in the Provisioning category:
- Node count running Flatcar Container Linux
- OS version distribution across nodes
- Update status — whether all Flatcar nodes are up to date
- Health indicator based on update currency
- Demo mode with realistic mock data; live mode from Kubernetes Node info
Real-Time Cluster Creation Progress
Creating or deleting clusters now shows phased progress with real-time WebSocket updates:
- Progress states:
validating→creating/deleting→done/failed - Inline progress banner with spinner and progress bar
- Docker pre-flight check: Catches missing Docker daemon before kind/k3d creation fails
- Auto-refreshes cluster list on completion
- Auto-dismiss on success
KeepAlive Route Caching
Dashboard navigation is ~18% faster with KeepAlive route caching:
- Previously visited dashboards render instantly without re-mounting or re-fetching
- LRU cache preserves up to 8 route component instances
- No configuration needed — transparent performance improvement
What’s New (2026-02-24 to 2026-03-01)
This section summarizes features and improvements added in the week of 2026-02-24 through 2026-03-01.
Mission Browser: Installers & Solutions
The AI Mission sidebar now includes a Mission Browser with two tabs:
- Installers — Pre-packaged missions for deploying tools and infrastructure (Prometheus, Gatekeeper, etc.) from the curated knowledge base. Cards show CNCF category tags, GitHub author avatars, and install buttons.
- Solutions — Higher-level solutions combining multiple installers.
Cards load progressively as they are fetched, showing results immediately. Each card includes author attribution with GitHub avatar and profile link.
Mission Recommendations
The Mission Browser now shows personalized recommendations with explanations. Each recommendation includes a “match reason” explaining why it’s relevant — for example, “Recommended because your clusters have GPU nodes but no monitoring configured.”
AI Mission Sharing & Security Scanning
Missions can be shared via the new Share dialog:
- Export missions as JSON or push to a watched repository
- Automatic security scanning before sharing to detect secrets or sensitive data
- Import missions from external sources with lazy knowledge base matching
Token Guidance Banner
A new banner in the Mission Browser shows estimated token costs for browsing and installing missions, helping teams manage AI spending.
AI-Driven Policy Creation
The OPA Policies card now includes a Create Policy modal powered by AI. Describe the policy you want in plain English, and the AI generates the ConstraintTemplate and Constraint YAML. Review and apply to selected clusters.
Thanos Monitoring Card
New Thanos Monitoring Status card showing sidecar, store gateway, compactor, and query health across clusters.
wasmCloud Monitoring Card
New wasmCloud Monitoring card displaying host status, running actors, capability providers, and lattice health.
GitHub Copilot CLI as Agent Provider
GitHub Copilot CLI is now supported as an AI agent provider alongside Claude and other providers. The console includes refactored Copilot agents (from kagenti skills) for cluster analysis, code review, and security recommendations.
GitHub Enterprise OAuth
The console now supports GitHub Enterprise Server as an OAuth provider. Set GITHUB_URL to your GHE instance URL and the console adjusts all OAuth and API endpoints automatically. The public_repo scope has been removed — basic user profile data is requested.
kc-agent Background Daemon
The start.sh script now runs kc-agent as a background daemon automatically, eliminating the need for a separate terminal.
Active User Count in Navbar
The navbar header now displays the count of active users currently connected to the console.
Theme Uninstall
Marketplace-installed themes can now be uninstalled from Settings > Appearance.
Dashboard Import Suggestions
When opening the dashboard import dialog, the console suggests matching missions from the knowledge base with lazy loading.
Performance Improvements
- Vendor chunk splitting — Framework bundles are separated from application code for better caching
- Gzip compression — All responses compressed, reducing transfer sizes by ~70%
- Two-phase OPA loading — OPA card renders instantly with cached data, background refresh follows
- Parallel OPA cluster checks — Cluster Gatekeeper detection now runs in parallel instead of sequentially
- OPA timeout increase — Phase 1 timeout raised to 25s with 60-minute cache TTL for slow clusters
- Fix for ERR_INCOMPLETE_CHUNKED_ENCODING — Resolved streaming errors on slow networks
GPU Reservations Improvements
- Eye icon toggle for viewing reservation details
- Auto-approval workflow for GPU reservation requests
- Always-live data mode (no demo fallback on connected clusters)
- Demo fallback restored for localhost development
OPA / Gatekeeper Detection Fixes
Multiple fixes to improve OPA Gatekeeper detection across different cluster types:
- Fixed detection on platform-eval and vllm-d clusters
- Fixed detection on late-reachable clusters (slow network)
- Better handling of slow clusters with progressive timeouts
Accessibility Improvements
- Added missing
aria-labelsto allrole="button"elements - Added keyboard navigation (Tab, Enter, Escape) to dropdown menus and tab bars
- Added keyboard support for dialog backdrop dismissal
- Confirmation dialogs added for all destructive actions
Theme & UI Quality
- Replaced hardcoded hex colors with CSS variables and Tailwind theme tokens across all components
- Dark mode variants added for all light-only gray color classes
- Normalized spacing to 4px/8px grid system
- Fixed gradient action button contrast in light themes
- Improved tour accuracy for sidebar sections and card headers
- Health indicators added to dashboard components and card wrappers
Code Quality & Reliability
- Fixed 25
anytype usages across card components for better type safety - Added
ErrorBoundarytoCardWrapperfor graceful card failure handling - Added
isDemoDatasupport to status cards missing demo mode wiring - Wrapped all
localStoragecalls in try/catch for private browsing compatibility - Cleared all
setTimeout/setIntervalon unmount to prevent memory leaks - Added toast notifications to error catch blocks (replacing silent failures)
- Replaced wildcard lucide-react imports with named imports for smaller bundles
Analytics & Tracking
- Added UTM tracking parameters and live demo links
- New analytics event emitters for Deploy, Compliance, and Login flows
- GA-driven UX improvements: session tracking, agent activity, tour completion, dashboard usage